

The Role of Doji Candlesticks in Identifying Trend Reversals
- Share.Market
- 5 min read
- 17 Mar 2025


Doji candlestick patterns are a key component of technical analysis, often signaling market indecision and potential trend reversals. This article explores their formation, variations, and practical application in stock trading, evaluating their effectiveness in predicting market shifts.
Understanding the Basics
What is a Doji Candlestick, and When Does It Occur?
The term Doji originates from the Japanese word meaning “the same thing.” A Doji candlestick forms when a security’s opening and closing prices are nearly identical within a trading session. This pattern indicates market uncertainty, where neither buyers nor sellers gain control, leaving the future price direction unclear.
Formation & Key Variations of Doji Candlesticks
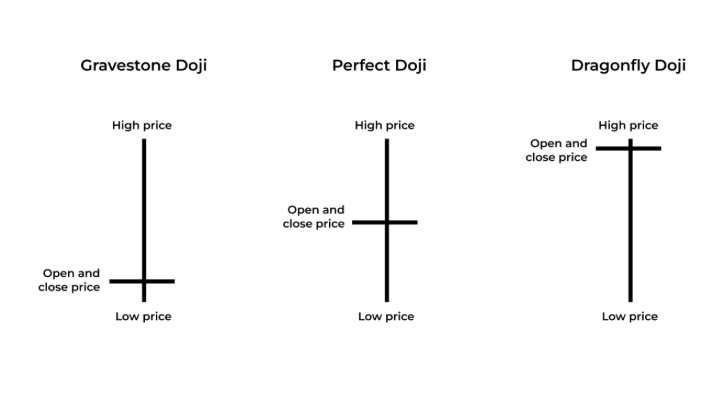
A Doji is characterized by a small or nonexistent body with long upper and lower shadows. It represents market indecision and can take several forms:
- Perfect Doji: Indicates pure market indecision, often appearing after a strong trend.
- Dragonfly Doji: A bullish reversal pattern with a long lower shadow, suggesting buying pressure.
- Gravestone Doji: A bearish reversal pattern with a long upper shadow, indicating selling pressure.

Doji as a Reversal Signal:
Beyond indecision, Doji patterns can also signal potential trend reversals, particularly when they appear after a prolonged uptrend or downtrend. Traders closely analyze their occurrence within broader market conditions to assess possible shifts in momentum.
Next: A 13-Year Doji Pattern Analysis
Now that we have covered the fundamentals, we will dive into a 13-year analysis, examining the impact of Doji patterns across multiple timeframes and major stock indices. This deep dive will provide valuable insights into their role in market forecasting.
Data Analysis and Findings:
To assess the effectiveness of Doji patterns in identifying trend reversals, Share.Market conducted a 13-year analysis, focusing on Perfect Doji formations. The study utilized daily and 5-minute candlestick data from prominent indices: Nifty 50, Bank Nifty, Sensex, and Bankex, starting from January 1, 2012. Below is a summary of our findings:
Data Sources and Methodology:
We analyzed historical price data from the Nifty 50 stocks and the major indices to determine the predictive power of Perfect Doji patterns. The focus was on identifying potential trend reversals after an established trend, especially for short-term movements.
What is a Perfect Doji?
A Perfect Doji occurs when the opening and closing prices are nearly identical, forming a candlestick with minimal body and long upper and lower shadows. It signifies indecision and often appears after a well-established trend, signaling potential market shifts.
Identifying Trend Reversals:
To confirm a Perfect Doji as a reversal signal, we first establish the direction of the preceding trend (1-3 candles). After the Doji, we monitor the subsequent candles to verify the trend reversal.
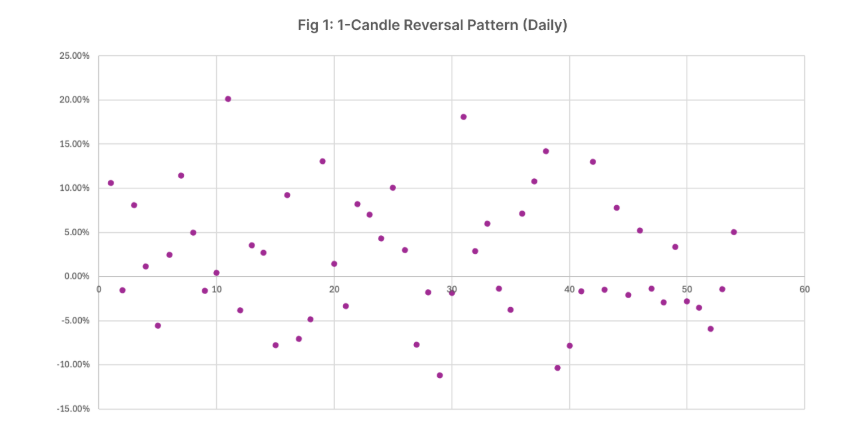
Results: Daily Timeframe (13 Years)
1-Candle Reversal Pattern:
When analyzing a 1-candle reversal following a Perfect Doji, we observed a modest positive expected value. This suggests that, in the short term, a Doji pattern after a significant uptrend or downtrend does show some inclination towards reversal, across all indices (Nifty 50, Bank Nifty, Sensex, Bankex). (See Fig 1)

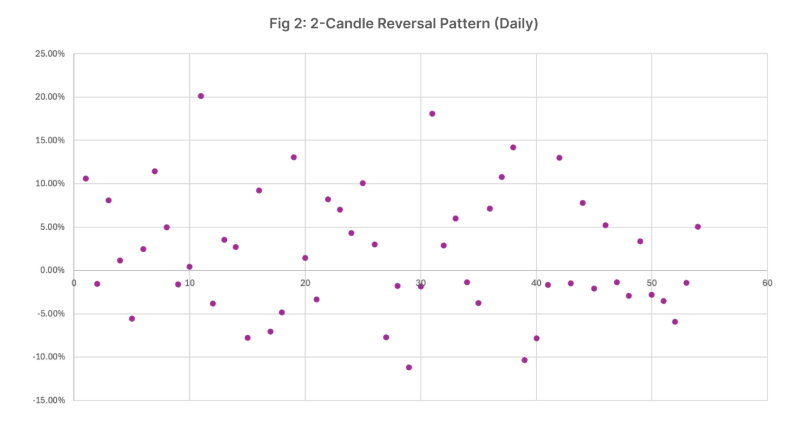
2-Candle Reversal Pattern:
In contrast, the expected value declined significantly when extending the analysis to a 2-candle reversal. This indicates that the likelihood of a reversal diminishes after two candles. The trend often continued in the initial direction, rather than reversing. (See Fig 2)

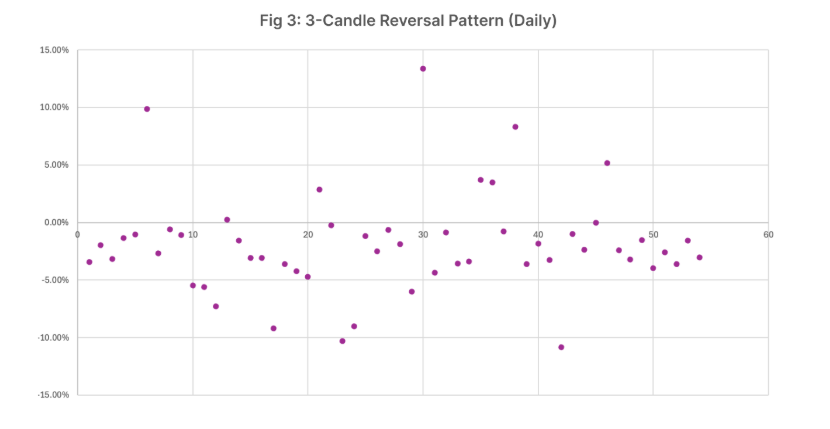
3-Candle Reversal Pattern:
Similarly, when examining a 3-candle reversal, the expected value of trend reversal decreased further, signaling that Doji patterns lose reliability for longer timeframes. This underlines that Doji patterns are more effective in predicting short-term shifts. (See Fig 3)

Results: 5-Minute Timeframe (60 Days)
To explore the Doji’s performance in faster market conditions, we analyzed 5-minute candlestick data from 30th Dec ’24 to 21st Feb ’25. The results showed:
- The Perfect Doji exhibited a higher success rate on shorter timeframes (5 minutes) compared to the daily timeframe, though still showing diminishing predictive power after the 1st candle. (See Fig 4, 5, 6)

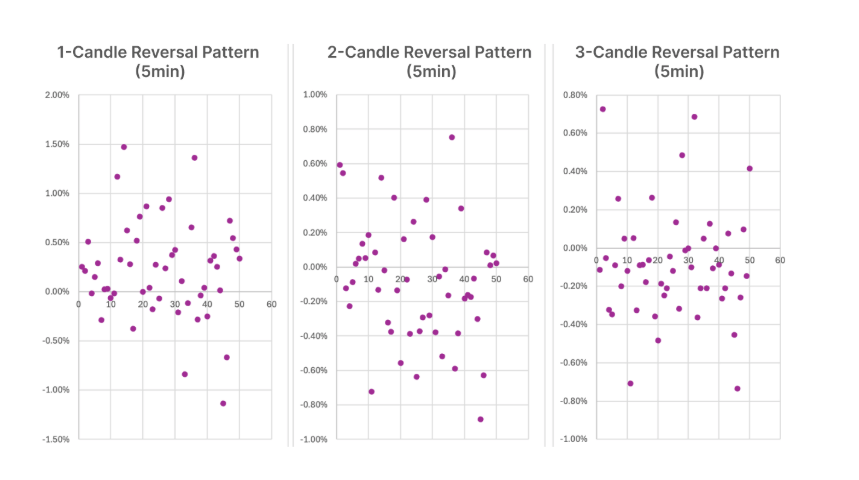
- Dragonfly Doji (bullish reversal) and Gravestone Doji (bearish reversal) patterns, however, performed notably better on the 5-minute timeframe. These directional patterns had a higher success rate, which suggests they are more reliable in volatile market conditions where quick price action drives sentiment.
Key Observations:
- Short-Term Reversals (1 Candle): Doji patterns, especially the Perfect Doji, demonstrated the highest success rate for predicting short-term trend reversals (1 candle), across both daily and 5-minute timeframes.
- Long-Term Reversals (2-3 Candles): The predictive power of Doji patterns weakened when considering 2 or more candles for reversal, indicating that Doji patterns are less reliable as sole indicators for longer-term trend changes.
- Dragonfly and Gravestone Doji: The Dragonfly (bullish) and Gravestone (bearish) patterns showed higher success rates, especially on shorter timeframes. These variations, with clear directional biases, proved to be more reliable when market conditions are volatile.
While Doji patterns offer insight into short-term market shifts, they should not be relied upon as the only definitive signals for trend reversals in isolation, as Doji patterns also have limitations that traders should be aware of. Some of these limitations are: –
- Market conditions and timeframes significantly influence the reliability of Doji signals.
- Confirming signals from other technical indicators can enhance prediction accuracy.
- The risk of false positives means that Doji patterns should always be cross-verified before making trading decisions.
Doji candlestick patterns remain a valuable tool for traders aiming to interpret market indecision and identify potential trend reversals. However, their predictive power is enhanced when used alongside other technical indicators, like moving averages, RSI, or support/resistance levels.


