

Market Trends and Opportunities in the Plastic Industry
- Share.Market
- 7 min read
- 22 Jan 2025


Plastic has seamlessly integrated into various facets of everyday life. Right from packaging materials to important roles in the construction, automotive, and electronics sectors, it is present everywhere.
Its adaptability, ease of production, and cost-effectiveness have fueled its increasing demand, gradually replacing traditional materials like glass, metals, wood, and natural rubber.
Despite exponential growth, the plastics industry remains subject to stringent regulations worldwide, indicative of its profound environmental and health implications.
In this article, we’ll analyse plastic manufacturing, the industry trends, forecasts, key drivers, and challenges, including bioplastics adoption and circular economy models.
Plastic Industry Overview
The global market size of the plastic industry stood at USD 712 billion in 2023 and is projected to reach a size of USD 1,050 billion by the end of 2033. Expanding at a CAGR of 4% during the forecasted period.
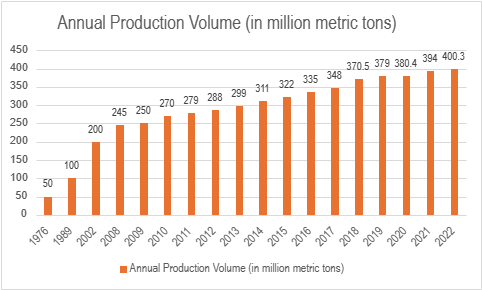
The worldwide production of plastics reached a staggering number of 400.3 million metric tons in 2022. This marks an increase of about 1.6% from the previous year.
Global plastic use is projected to continue rising over the coming decades to reach more than 1.2 billion metric tons by 2060.
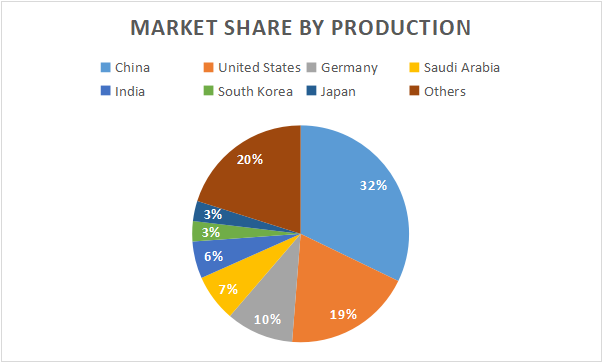
In 2022, the top three countries in plastic manufacturing by volume are: China, which accounts for 32% of global production with 112 million tonnes; the United States accounts for 19% of global production producing 66.5 million tonnes; and Germany contributes 10%, producing 35 million tonnes.
Below is the Market Share of Plastic Production Worldwide
The predominant type of plastic produced globally is Polyethylene (PE), accounting for approximately 28.5% of global plastic production in the top seven countries. Polypropylene (PP), closely followed at around 16.7% globally likely a similar percentage of PP production in each of the top 7 countries.
Market Segmentation and Types
The plastic industry has two main segmentation strategies to categorise and understand the market:
Product Type (Chemical Structure and Properties):
The focus is mainly on the chemical composition and properties like strength, weight, clarity and recyclability. It helps identify which plastic type is best suited for a particular application based on its properties.
End-Use application (Industry utilizing and Plastic):
The focus is on the industry or application where the plastic product is used. This allows companies to customize products to the specific requirements of different industries. For instance, plastics used in medical devices need to be sterile and biocompatible, while those used in construction need to be durable and weather-resistant.
Based on global production volume and versatility, list of the top 4 used plastic types and their major end-use applications:
| Plastic Type | Key Properties | Major End-Use Applications |
| Polyethylene (PE) | Lightweight, Affordable, Versatile | Packaging and Construction |
| Polypropylene (PP) | Strong, Chemical Resistant | Packaging, Textiles and Automotive |
| Polyethylene Terephthalate (PET) | Clear, Recyclable | Packaging and Textiles |
| Polyvinyl Chloride (PVC) | Durable, Rigid | Construction and Medical Devices |
Overview of the Indian Plastic Industry
The Indian plastic industry has been a key player in the country’s economy since 1957, starting with polystyrene production. It has grown rapidly, with over 2,000 exporters and creating jobs for over 4 million people in 30,000 processing units, 85%-90% are small and medium enterprises in FY23.
India makes various plastic products like housewares, packaging items, and medical supplies, contributing Rs. 3 lakh crore to the economy. The government aims to boost this to Rs. 10 lakh crore in 4-5 years.
Also, 10 Plastic Parks are being set up across the country, with final approval for six parks in states like Madhya Pradesh, Assam, and Tamil Nadu, aiming to create more jobs and promote eco-friendly growth.
| S.No | Location of Plastic Park | Final Approval date | Land area(Acre) | No. of Plots | Total Project Cost (Rs cr) | Total GoI support approv ed for the project (Rs cr) | GoI support released till date(Rs cr) |
| 1 | Tamot, Madhya Pradesh | 09.10.2013 | 122 | 155 | 108 | 40 | 35.9 |
| 2 | Paradeep, Odisha | 09.10.2013 | 120 | 80 | 106.78 | 40 | 36 |
| 4 | Tinsukia, Assam | 21.02.2014 | 173 | 104 | 93.65 | 40 | 29 |
| 5 | Deoghar, Jharkhand | 20.12.2018 | 93 | 107 | 67.33 | 33.67 | 30.3 |
| 6 | Bilaua, Madhya Pradesh | 20.12.2018 | 93 | 107 | 68.72 | 34.36 | 18.89 |
| 3 | Thiruvallur Tamil Nadu | 30-7-2019 | 239.82 | 79 | 216.92 | 40 | 22 |
| 7 | Sitarganj, Uttarakhand | 03.12.2020 | 40 | 45 | 67.73 | 33.93 | 18.64 |
| 8 | Sarora, Raipur, Chhattisgarh | 13.04.2021 | 47.29 | 55 | 42.09 | 21.045 | 4.21 |
| 9 | Ganjimutt, Karnataka | 21.01.2022 | 112 | 53 | 62.78 | 31.38 | NIL |
| 10 | Gorakhpur, Uttar Pradesh | April, 2022 | 88 | 92 | 69.58 | 34.79 | NIL |
India’s Plastic Exports in FY23
In the fiscal year 2023, India’s plastic exports amounted to USD 11.96 billion, showcasing significant growth in specific sectors. Notable increases were observed in writing instruments and stationery, medical items, and plastic pipes and fittings. However, there was a 10.4% decrease compared to the previous year’s exports valued at USD 13.35 billion.
In February 2023, India’s overall exports of Indian merchandise export were down by 8.8% compared to the year before, totaling USD 33.9 billion. The reason for this was plastics. In the same month, India exported plastic worth USD 872 million, which was 17.2% less than February 2022. Other types of plastic, like plastic sheets exports dropped by 21.2% and raw materials exports dropped by 28.9%. These changes added up to a 10.4% decrease in total plastic exports compared to the previous year, which was USD 13.35 billion.
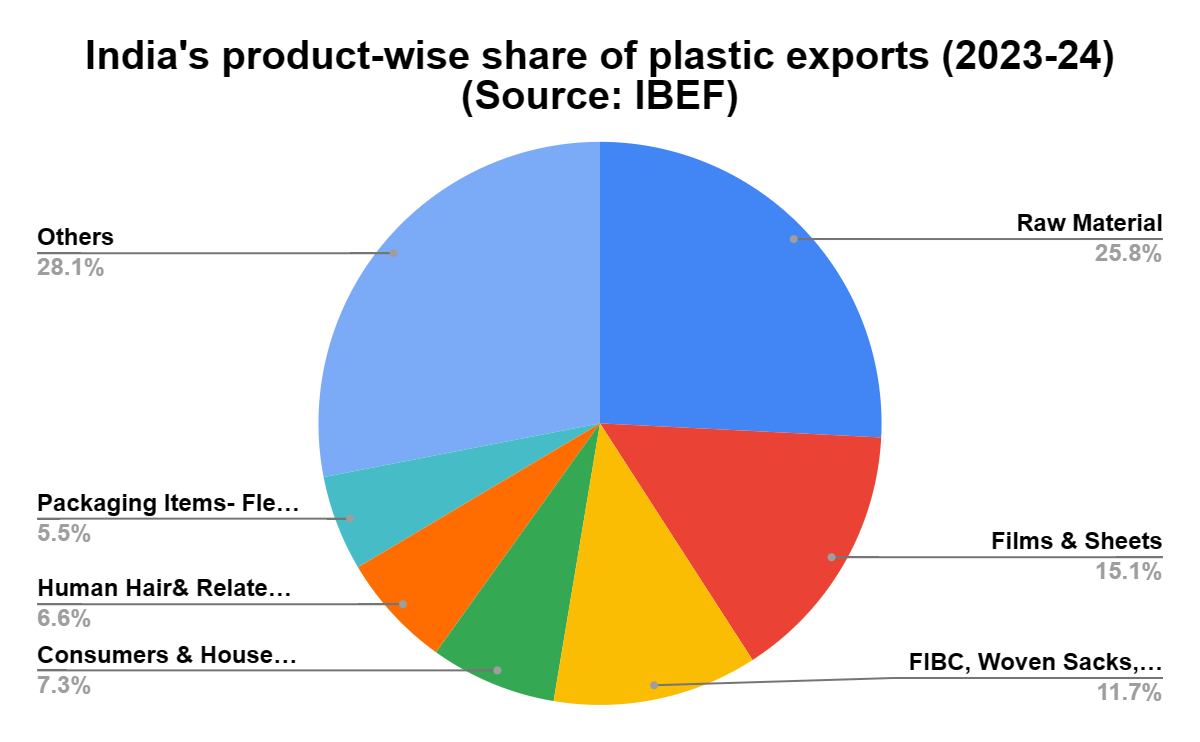
Composition of Plastic Exports
Plastic raw materials constituted a substantial portion, accounting for 27.76% of total exports. This segment recorded a remarkable growth of 21.5% over the previous year. Conversely, plastic films and sheets experienced a decline of 10.6%.
Key Export Destinations
India exports plastic products to over 200 countries globally, with major destinations including the USA, China, and the UAE. Notably, exports to the USA decreased by 4.71% year-on-year, while those to China stood at USD 690.95 million.
Focus on France and International Collaboration
The total plastic exports to France in 2022-23 amounted to USD 211.4 million. Efforts are underway to enhance exports through collaborations and adherence to international standards.
New Opportunities through Free-Trade Agreements
Recent free-trade agreements with the UAE and Australia are expected to provide new opportunities for the plastics industry, facilitating further growth and expansion in the global market.
Top 5 Indian Companies in Indian Plastic Industry according to their Market Cap
| Company | Market Capitalization (Rs. Crore) | Revenue (Rs. Crore) | Net Profit (Rs. Crore) | Market Segment Focus |
| Supreme Industries Ltd. | 53,222 | 9,724 | 1,074 | Packaging, Plastics Products, Furniture |
| Astral Ltd. | 53,662 | 5,522 | 564 | Pipes, Drainage Systems, Adhesives |
| Finolex Industries Ltd. | 15,716 | 4,223 | 452 | Pipes, PVC Products, Water Management Solutions |
| Prince Pipes and Fittings Ltd. | 6,844 | 2,593 | 136 | Pipes, Fittings, Plumbing Solutions |
| VIP Industries Ltd. | 7,665 | 2,179 | 98 | Luggage, Travel Gear, Plastic Consumer Goods |
Price Performance of Stocks in the Plastic Industry
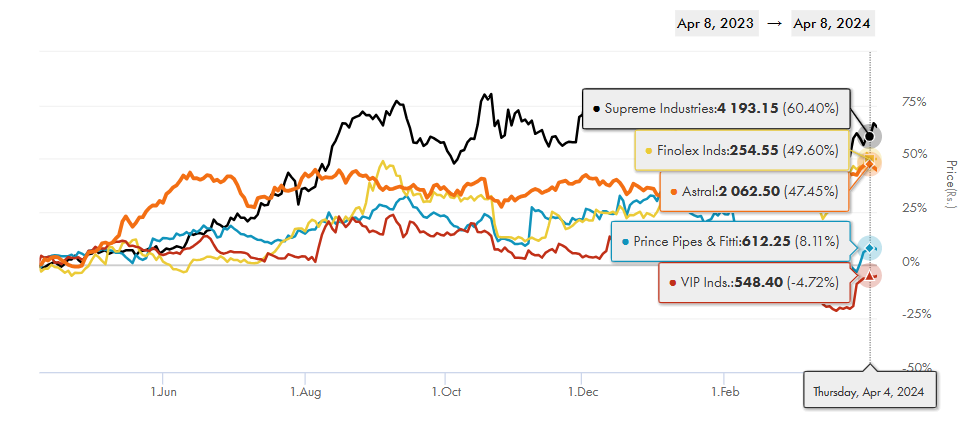
Supreme Industries has outperformed other companies in the industry. The company witnessed a sales growth of 6.16% on a quarter-on-quarter basis in Q3 FY24, with a PAT of Rs. 256 Cr. Additionally, its Return on Equity (ROE) stood at 20.95%.
Competitive Environment:
- New Entrants: High capital requirements and low consumer switching costs create medium barriers. B2B focus limits new entrants.
- Substitutes: Large companies use in-house facilities but rely on specialists for big projects. Environmental concerns drive demand for alternatives, posing a medium to high threat.
- Buyer Power: Major FMCG firms wield high bargaining power due to volume and resources. Limited brand loyalty boosts buyer negotiation leverage.
- Supplier Power: Suppliers lack differentiation, and the industry isn’t a primary customer, reducing their influence.
- Rivalry: Intense competition among numerous small and medium players. Price wars are common due to diverse offerings and cost structures.
Plastic Industry SWOT Analysis
- Strength: Plastic reigns supreme in versatility and affordability, offering unmatched performance at a low cost.
- Weakness: Environmental concerns and reliance on fossil fuels are major weaknesses, leading to plastic pollution and negative publicity.
- Opportunity: Sustainability is a golden opportunity. Bioplastics, improved recycling, and focus on developing markets offer a path forward.
- Threat: Stricter regulations, competition from eco-friendly alternatives, and volatile oil prices threaten the industry’s future.
Conclusion
The plastic industry faces both challenges and opportunities. Adapting to sustainability and innovation while meeting regulations will be key to its future success.


