

This Too Shall Pass
- Share.Market
- 16 min read
- 06 Mar 2025


Why Market Downturns Are Just Another Chapter In The Investing Journey
Let’s be honest – this isn’t the best time to check your portfolio. Watching it shrink day by day, feeling the sting of red numbers, and wondering, “Should I sell before it gets worse?” – we understand the concern. But here’s the thing – You ARE NOT ALONE.
Even though we feel it too. Market noise, psychological biases, and limited experience with downturns can cloud our judgment, making it even harder to stay calm.
We’re not saying investors lack understanding, but many entered the market after the COVID bull run – meaning less experience in facing a downturn firsthand.
Let’s be real. The last few months haven’t been kind to investors.
- The Nifty 50 is down by ~ 16%
- Nifty Midcap 150? Down ~ 20%
- Smallcap? They’ve taken the biggest hit – falling ~25%
So, the market is bleeding, but that’s not the end of the story.
If we check individual stocks, many of them are down 30-50% from their highs – even fundamentally strong companies, the majority of the stocks are getting punished.
And as always, the media is doing what they are known for – painting a picture of doom and gloom.
- Markets Crash Amid Global Uncertainty
- Worst Start to the Year for Indian Stocks in Decade
- FIIs Dump ₹1 Lakh Crore Worth of Shares.
And whatnot! It’s all very dramatic.
So just take a deep breath. Because this has happened before. The markets have been rough, but history tells us one thing: This too shall pass. Every single time, the market has bounced back stronger.
Legendary investor William O’Neil once said that major corrections are like a “spring cleaning” for the market – they remove excess and set the stage for the next rally.
We know investors want a quick answer to the market downturn – kind of like checking your portfolio and hoping for a miracle. But great things take time! Stick with us, and we’ll break it down without overwhelming you.
Why This Time Feels Worse? The Rise of the First-Time Investor!
A big reason this correction feels different is the explosion of retail investors in India.
If we look at the data
Region-wise distribution of total registered investors
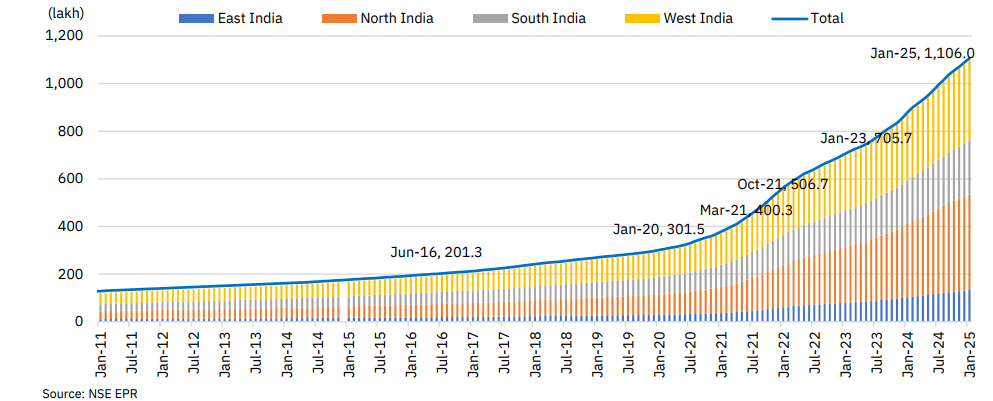
Before COVID, India had only 3 crore demat accounts but today the investor base hit the 11-crore mark in Jan 2025, adding 16.5 lakh new investors in a month! That’s a 20.8% jump in FY25 – proof that market confidence is stronger than ever.
That means a massive number of investors have never seen a real bear market before. Even more than 5 crore investors entered the market AFTER the 2022 correction.
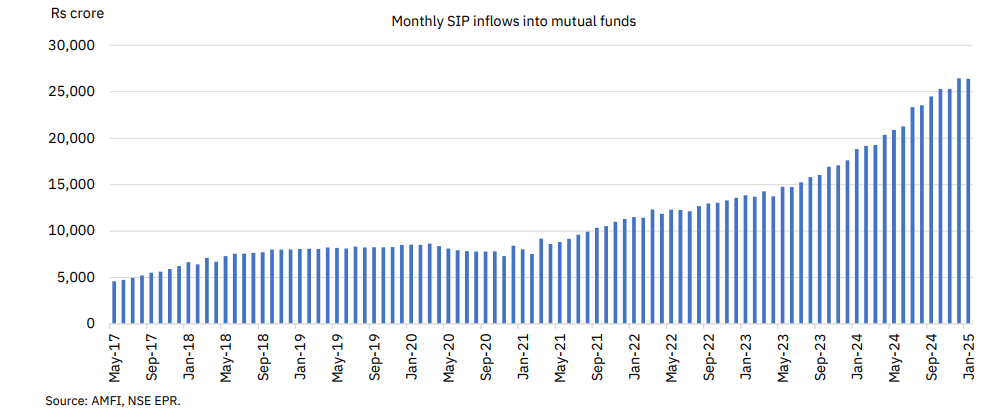
And if we see the investment through SIP, inflows are at record highs.
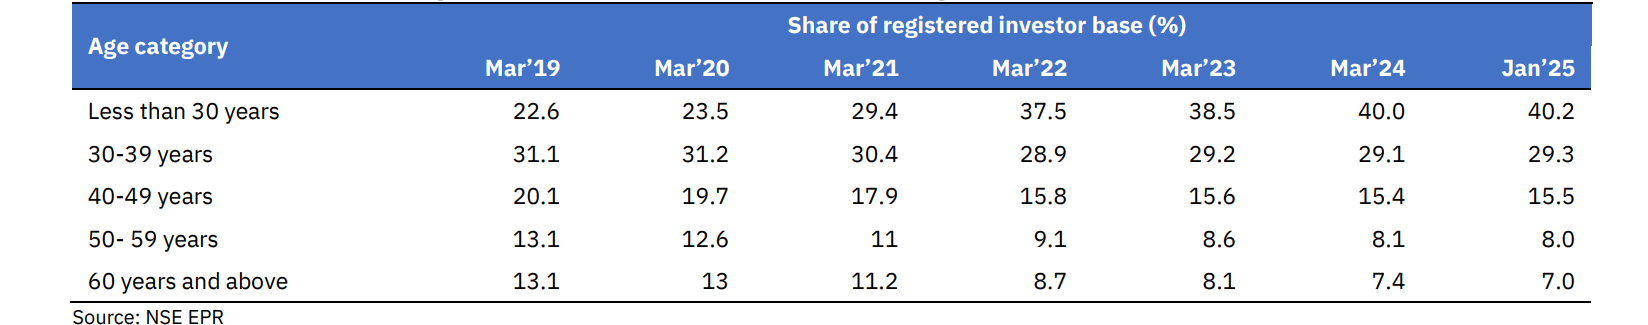
You will be shocked to see that more than 40% of today’s investors are under 30 years old.
For many investors, they are experiencing the bear market for the first time. Stocks that seemed like guaranteed winners are deep in the red. IPOs, smallcaps, and midcaps that gave insane returns post-COVID are now in sharp decline.
If we look at the investment in mainboard IPO, smallcap and midcap –
Annual trend on equity raised through IPOs on Mainboard
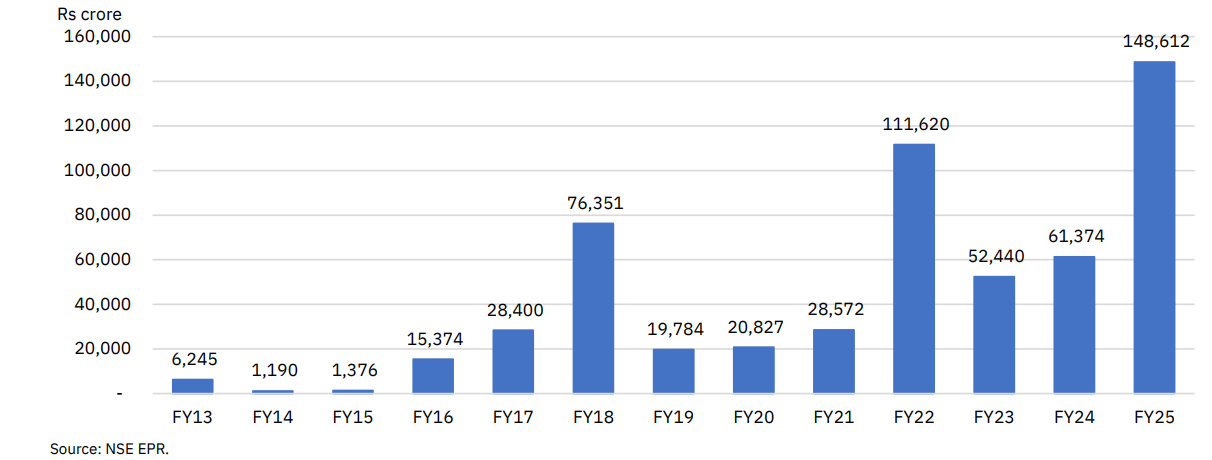
From FY24 to FY25, investments in mainboard IPOs have surged significantly. Midcap and Smallcap investments have also seen a notable rise.
Many of you invested money in hot IPOs, small caps, and midcaps, chasing high returns. During the post-COVID rally, stocks doubled in a month – but as said, higher returns come with higher risk.
Now, investors are realizing that stocks can fall just as fast as they rise. In fact they fall faster than they rise.
Why Is the Market Falling? The Real Reason!
If you ask 10 experts, you’ll get 10 different answers. They’re not wrong, but the real question is – what actually shook the market?
Markets fall when there are more sellers than buyers. That’s it.
But if we’re looking for the full picture, here’s what’s happening:
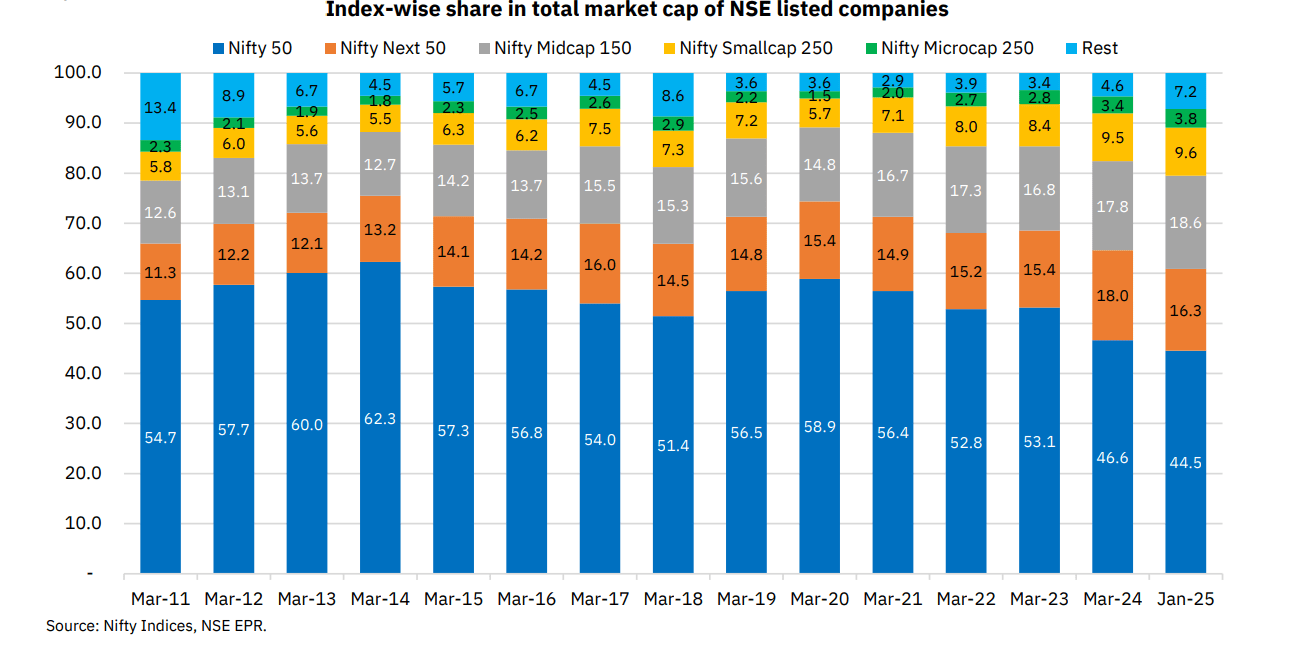
Indian Markets are Too Expensive
India’s market was one of the most expensive globally. Let’s look at three parameters to see if this statement is true.
Price-to-Earnings Ratio (P/E): How Much Are You Paying for Profits?
P/E tells you how much investors are paying for each rupee of earnings a company makes.
Now if you see the trend of Nifty’s PE –
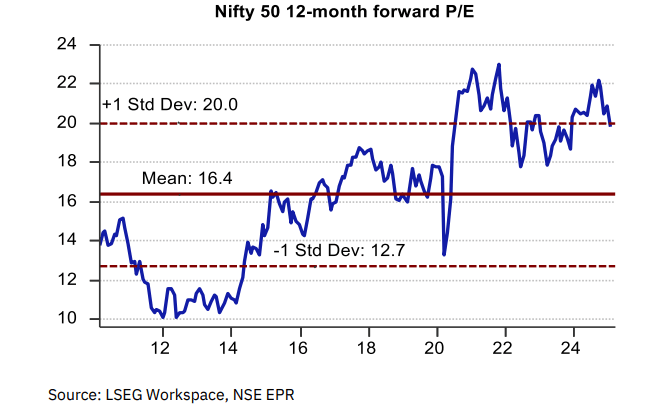
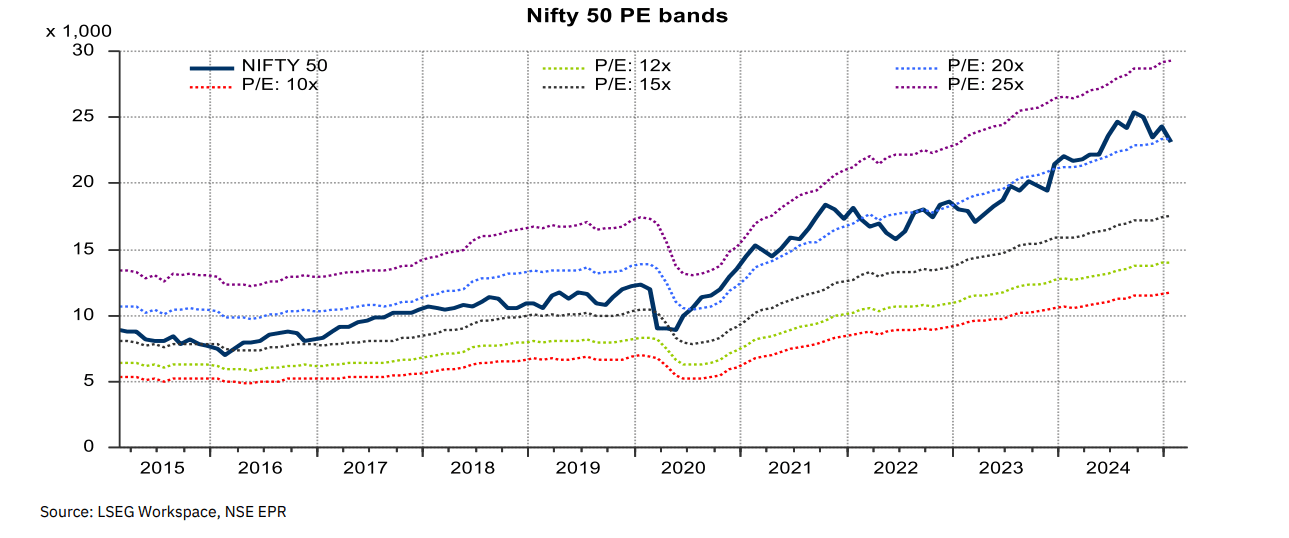
The charts show how the Nifty 50 index has moved over time in relation to its 12-month forward Price-to-Earnings (P/E) ratio, which helps understand market valuation.
Over time, its 12-month forward P/E ratio has guided investors on valuation trends. Typically, Nifty trades between 15x-20x P/E, a range considered “fair.”
Lower P/E (around 12x) signals undervaluation, while anything above 20x suggests a premium. Post-2020, confidence kept Nifty’s P/E above its long-term average of 16.4x, and in 2024, it’s hovering near 20x – higher than historical norms.
But context matters. Comparing global markets adds depth to the picture. For this, no one explains valuations better than the guru himself: Prof. Aswath Damodaran – worth checking out!
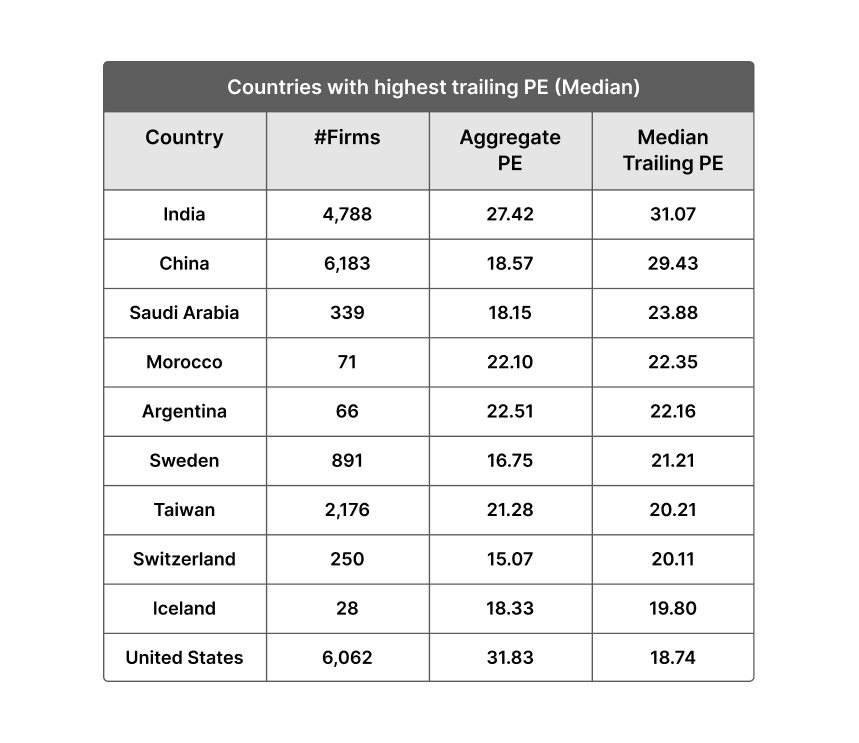
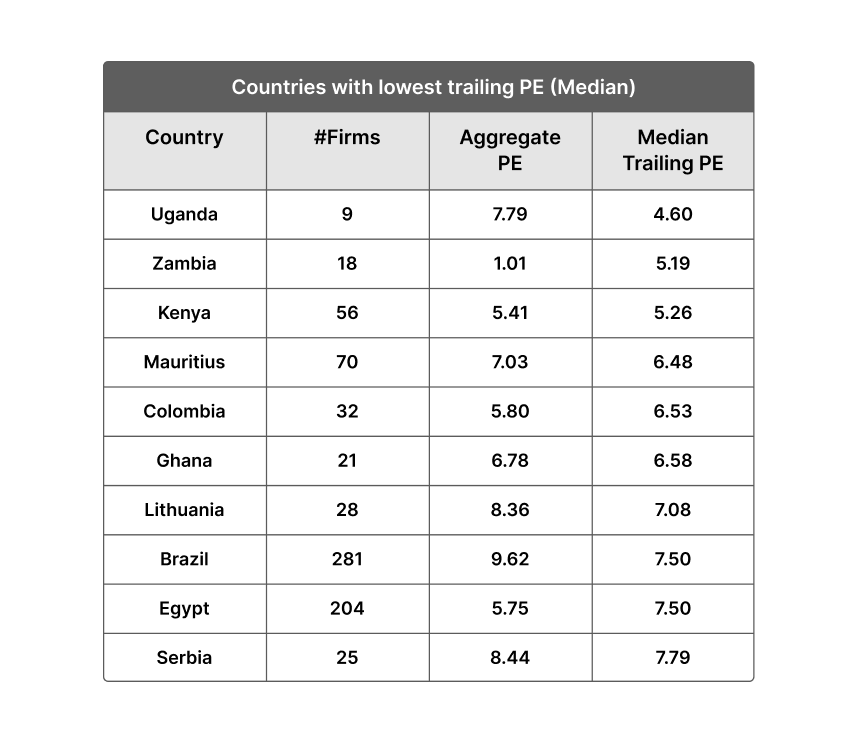
He said, “Two of the cheapest regions of the world to invest in are Latin America and Eastern Europe, but both carry significant risk with them and the third, Japan, has an aging population and is a low-growth market. The most expensive market in the world is India, and no amount of handwaving about the India story can justify paying 31 times earnings, 3 times revenue, and 20 times EBITDA, in the aggregate, for Indian companies. The US and China also fall into the expensive category, trading at much higher levels than the rest of the world, on all three pricing metrics.”
Cyclically Adjusted Price-to-Earnings Ratio (CAPE) – Adjusting for Economic Cycles
Not sure what CAPE is? Let’s simplify it.
The Cyclically Adjusted P/E (CAPE) ratio, by Prof. Robert Shiller, looks at 10 years of inflation-adjusted earnings to smooth out market ups and downs.
Unlike the regular P/E ratio, it helps spot long-term trends without short-term noise.
It tells you if the market is overvalued or undervalued with a broader perspective. Now, let’s dive into the numbers!
For reliable insights, we refer to the work of IIM professors Prof. Joshy Jacob and Prof. Rajan Raju.
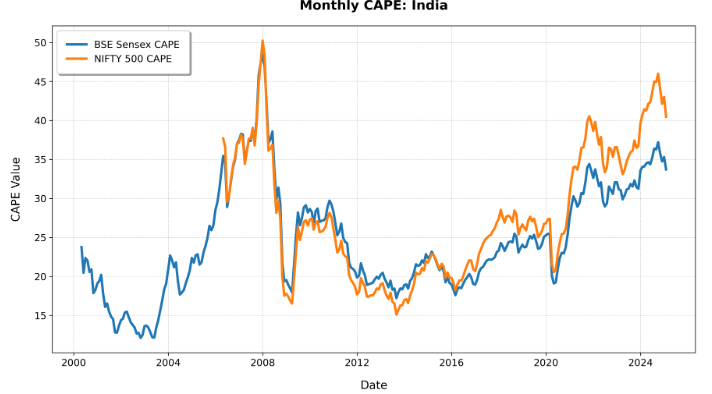
Before the 2008 crisis, CAPE crossed 45, and markets later crashed.
In 2020, CAPE dropped sharply during the COVID-19 crash but rebounded quickly.
Today, Nifty’s CAPE is again above 40, similar to past peaks.
While high CAPE reflects strong investor confidence, history shows that markets have seen corrections after such levels in previous cycles.
Market Cap to GDP (Buffett Indicator): Are Stocks Bigger Than the Economy?
One of the indicators suggesting this is the Buffett Indicator, named after investor Warren Buffett.
This ratio compares the total market value of all stocks to India’s GDP. If it’s too high, stocks are overvalued.
If we look at Nifty’s data –
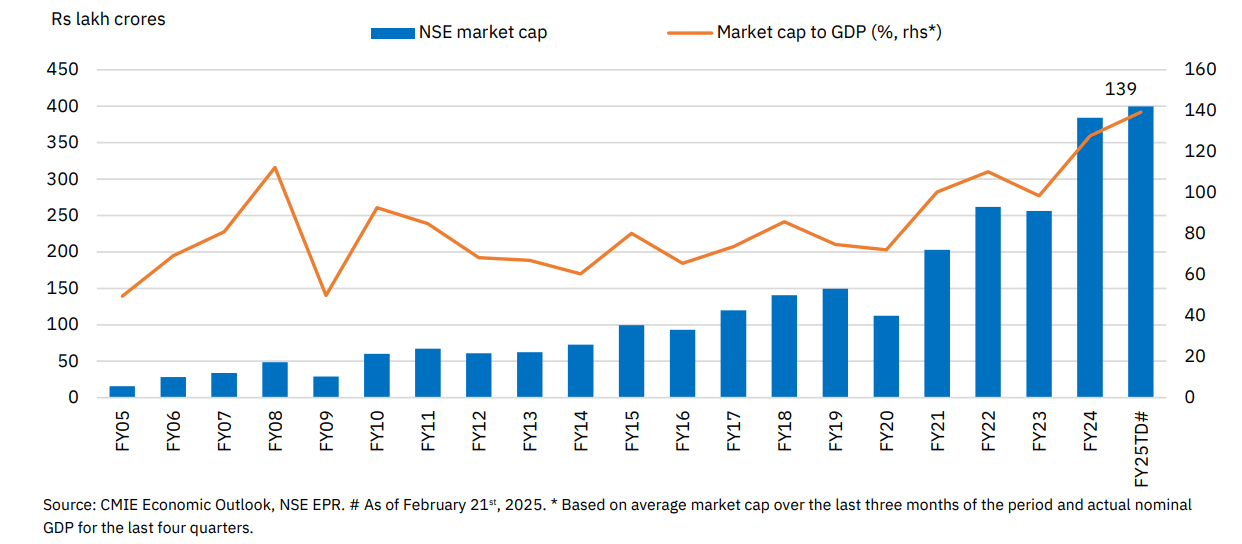
Just a few months ago, in September 2024, the stock market was at its peak, riding high with a market cap of ₹400 lakh crore.
Fast forward to February 2025, and we’ve seen a 15.6% dip in rupee terms – a reality check for many investors.
The Market Cap to GDP ratio, which once touched 147% in November, has now cooled to 139%.
But here’s the bigger picture – over the last 20 years, markets have grown at an impressive 17.6% annualized rate, proving that while short-term dips happen, the long-term trend has been one of solid growth.
FII’s Are Selling
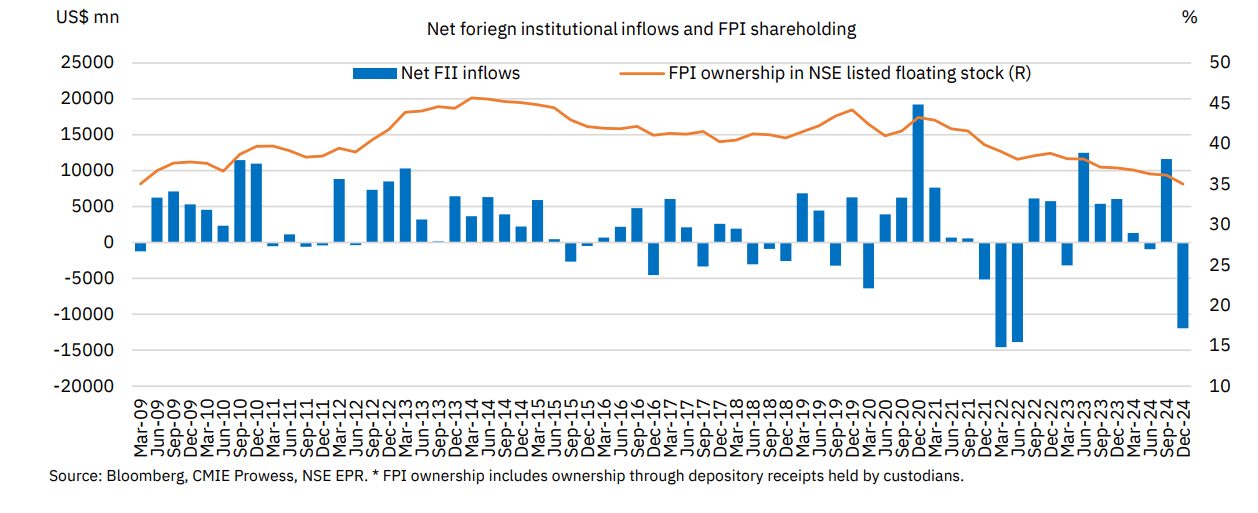
A few months ago, foreign investors were pumping money into Indian stocks. But by late 2024, things changed. Worried about high prices, slower growth, and U.S. rate cuts, they pulled out $11.9 billion – the biggest exit in 10 quarters.
And it didn’t stop there. Another $12.1 billion left in early 2025, with India and China taking the biggest hit as investors moved to safer U.S. bonds.
But not all hope is lost. Foreign investors still hold strong stakes in Financials, keeping some confidence in India’s market despite the outflows.
Do you really think India’s economy is so risky that FIIs won’t return? Hold on – we’ll break it down for you in a bit!
Slower Corporate Earnings Growth
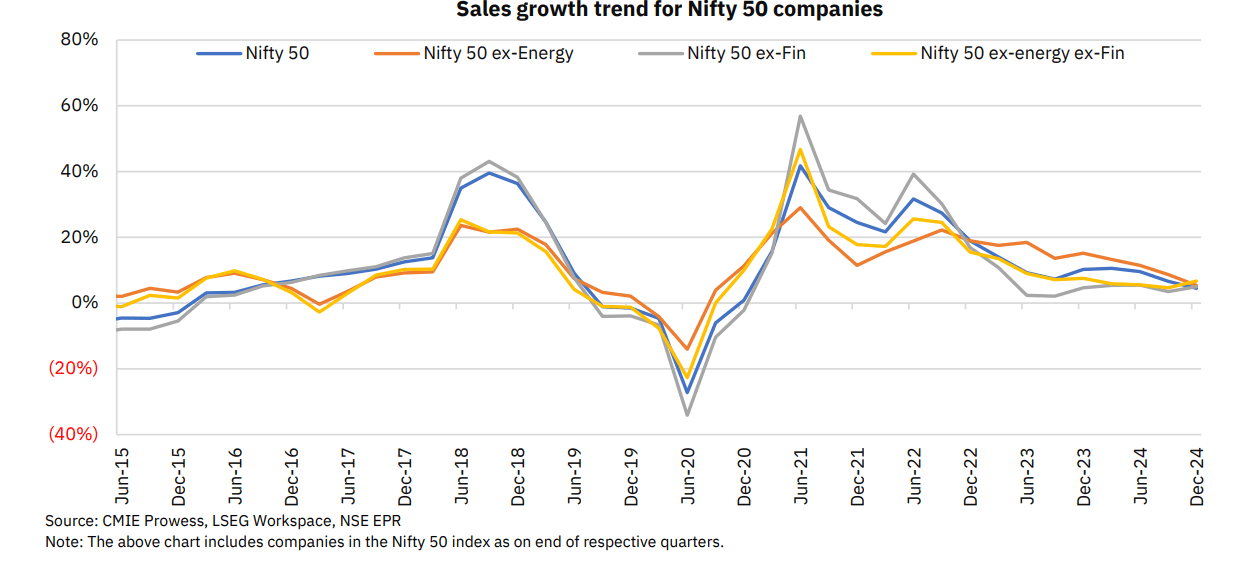
For months, the Nifty 50 companies have been hitting the brakes on revenue growth, slowing down quarter after quarter. It’s been a tough ride, with numbers slipping to their lowest in four years.
But then came the festive season – a much-needed boost. People were out shopping, upgrading their cars, and splurging on appliances, bringing Consumer Discretionary back to life.
Sector-wise net sales growth of Nifty 50 companies
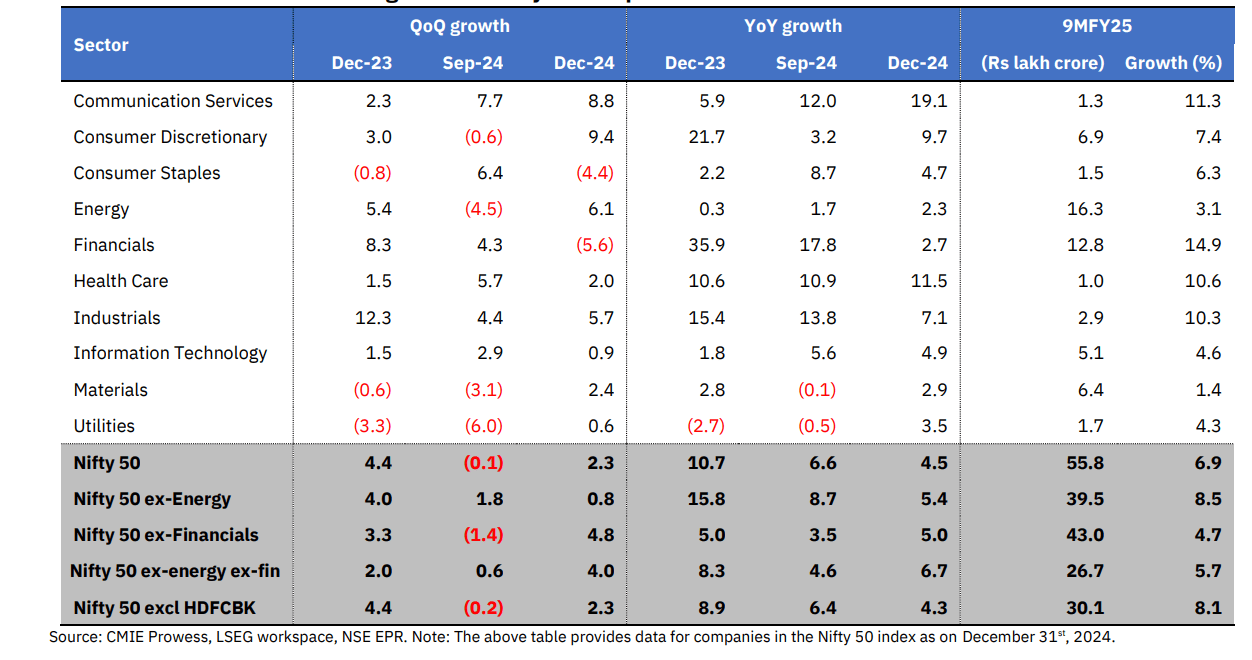
On the other hand, Financials and Energy, which make up a big chunk of Nifty’s revenues, didn’t have the best time.
Financials saw their weakest growth in a decade, this was due to losses in insurance, though banking and diversified financials managed to stay strong.
The Energy sector tried to bounce back, but falling crude prices kept it from picking up momentum.
But if there was one shining star, it was Communication Services. As data demand surged, the sector posted its best growth in two years.
While the overall market faced some turbulence, some pockets still found ways to thrive.
Global Macro Trends: The Bigger Picture Behind Market Declines
To understand the whole story of how macro factors impacted the market, let’s look at it from two perspectives.
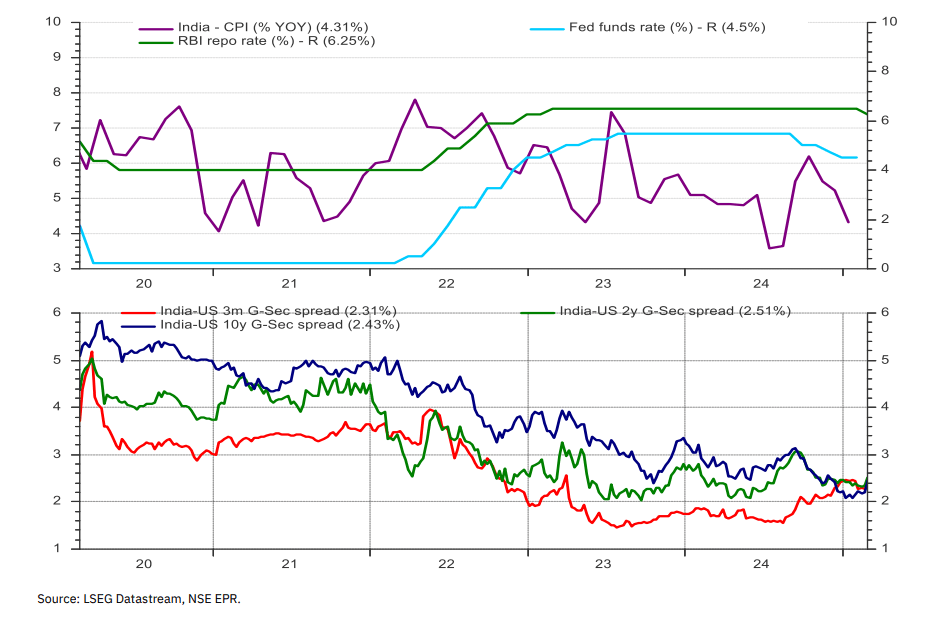
First US Federal Reserve’s Interest Rate Policies & Global Liquidity
The Fed’s aggressive rate hikes in 2023-24 made US bonds more attractive, pulling money out of markets like India and lowering risk appetite for Indian equities.
India vs. US policy rates and yield differential
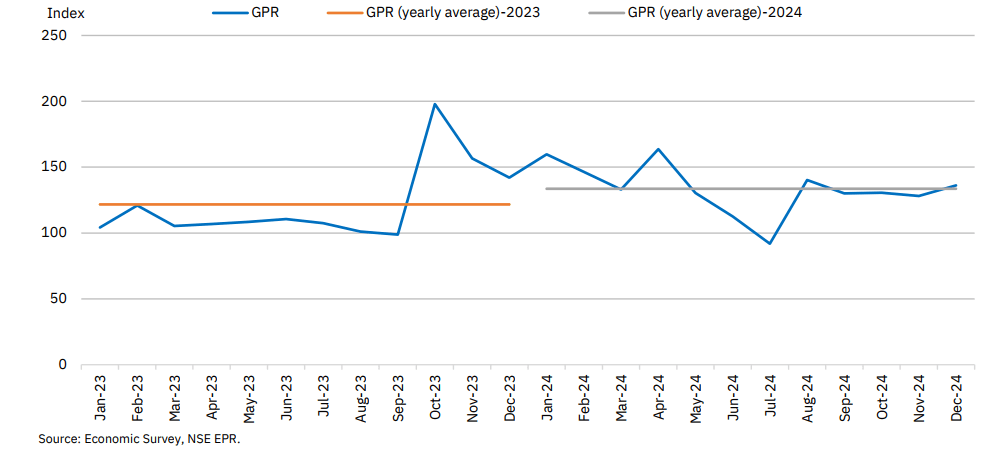
Second, Geopolitical Tensions
India imports over 80% of its crude oil, so higher prices mean higher inflation and a rising trade deficit. Global tensions, like the Middle East crisis and the Russia-Ukraine war, crude oil price swings.
Any spike forces the RBI to tackle inflation, delaying rate cuts and adding to market uncertainty.
Geopolitical Risk (GPR) Index remained high in 2024
Are We Near the Market Bottom? What the Data Says
We tried our best to give you a clear picture of why the market fell. But we know one question keeps investors up at night – “Will the market rise tomorrow?”
Understanding this without looking at historical data is like handing an empty glass to a thirsty person – useless!
Market crashes feel like the end, but history tells a different story – strong recoveries. Let’s compare 2008, 2020, and 2024-25 to see where we stand today.
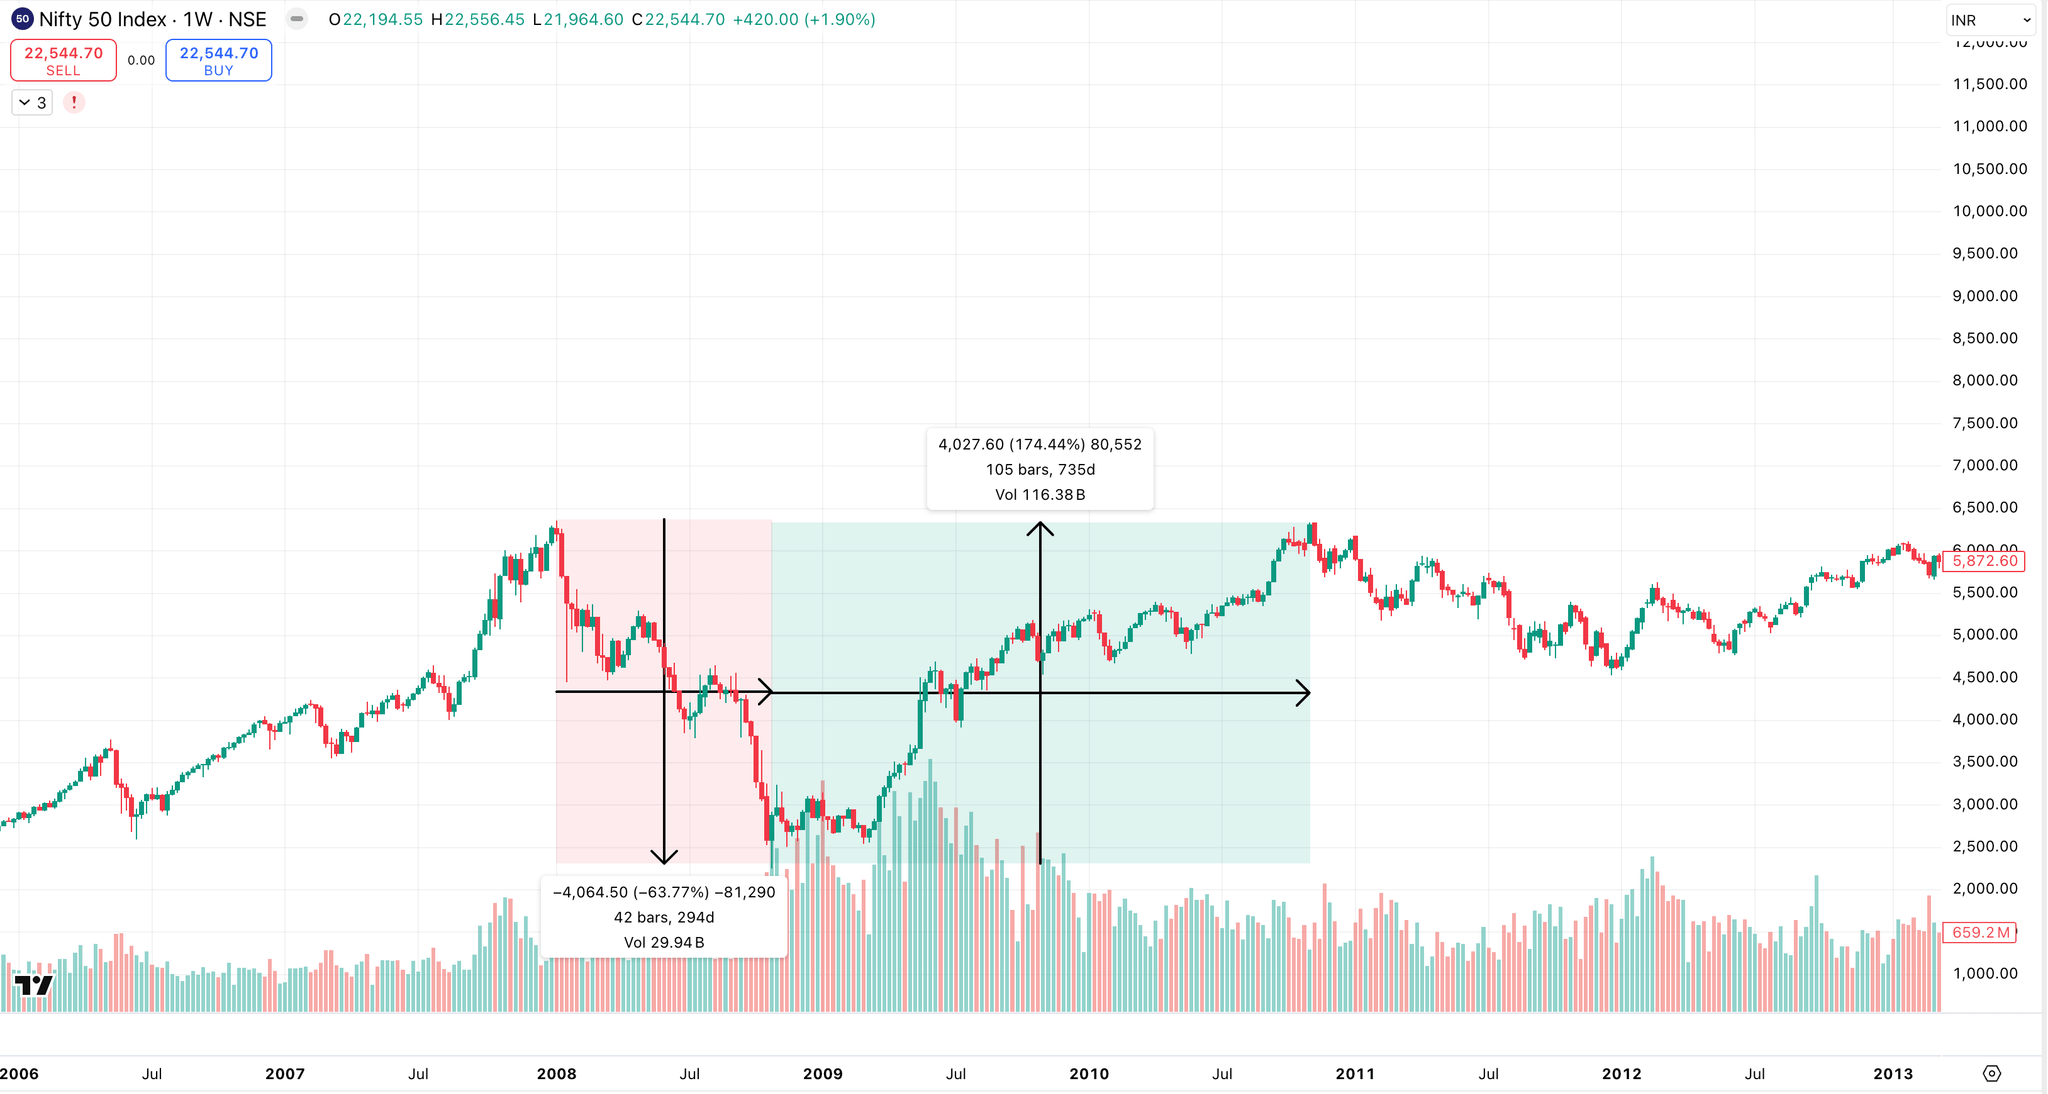
2008 Global Financial Crisis: The Worst Crash in Decades
When Lehman Brothers collapsed, it sent shockwaves through the global banking system – credit froze, banks failed, and economies tumbled into recession.
India wasn’t at the center of the storm, but FIIs pulled out big time, and Nifty fell by 63% in just 11 months. The market hit rock bottom in March 2009.
But guess what? It bounced back! In just 26 months, by November 2010, Nifty was back to pre-crash levels.
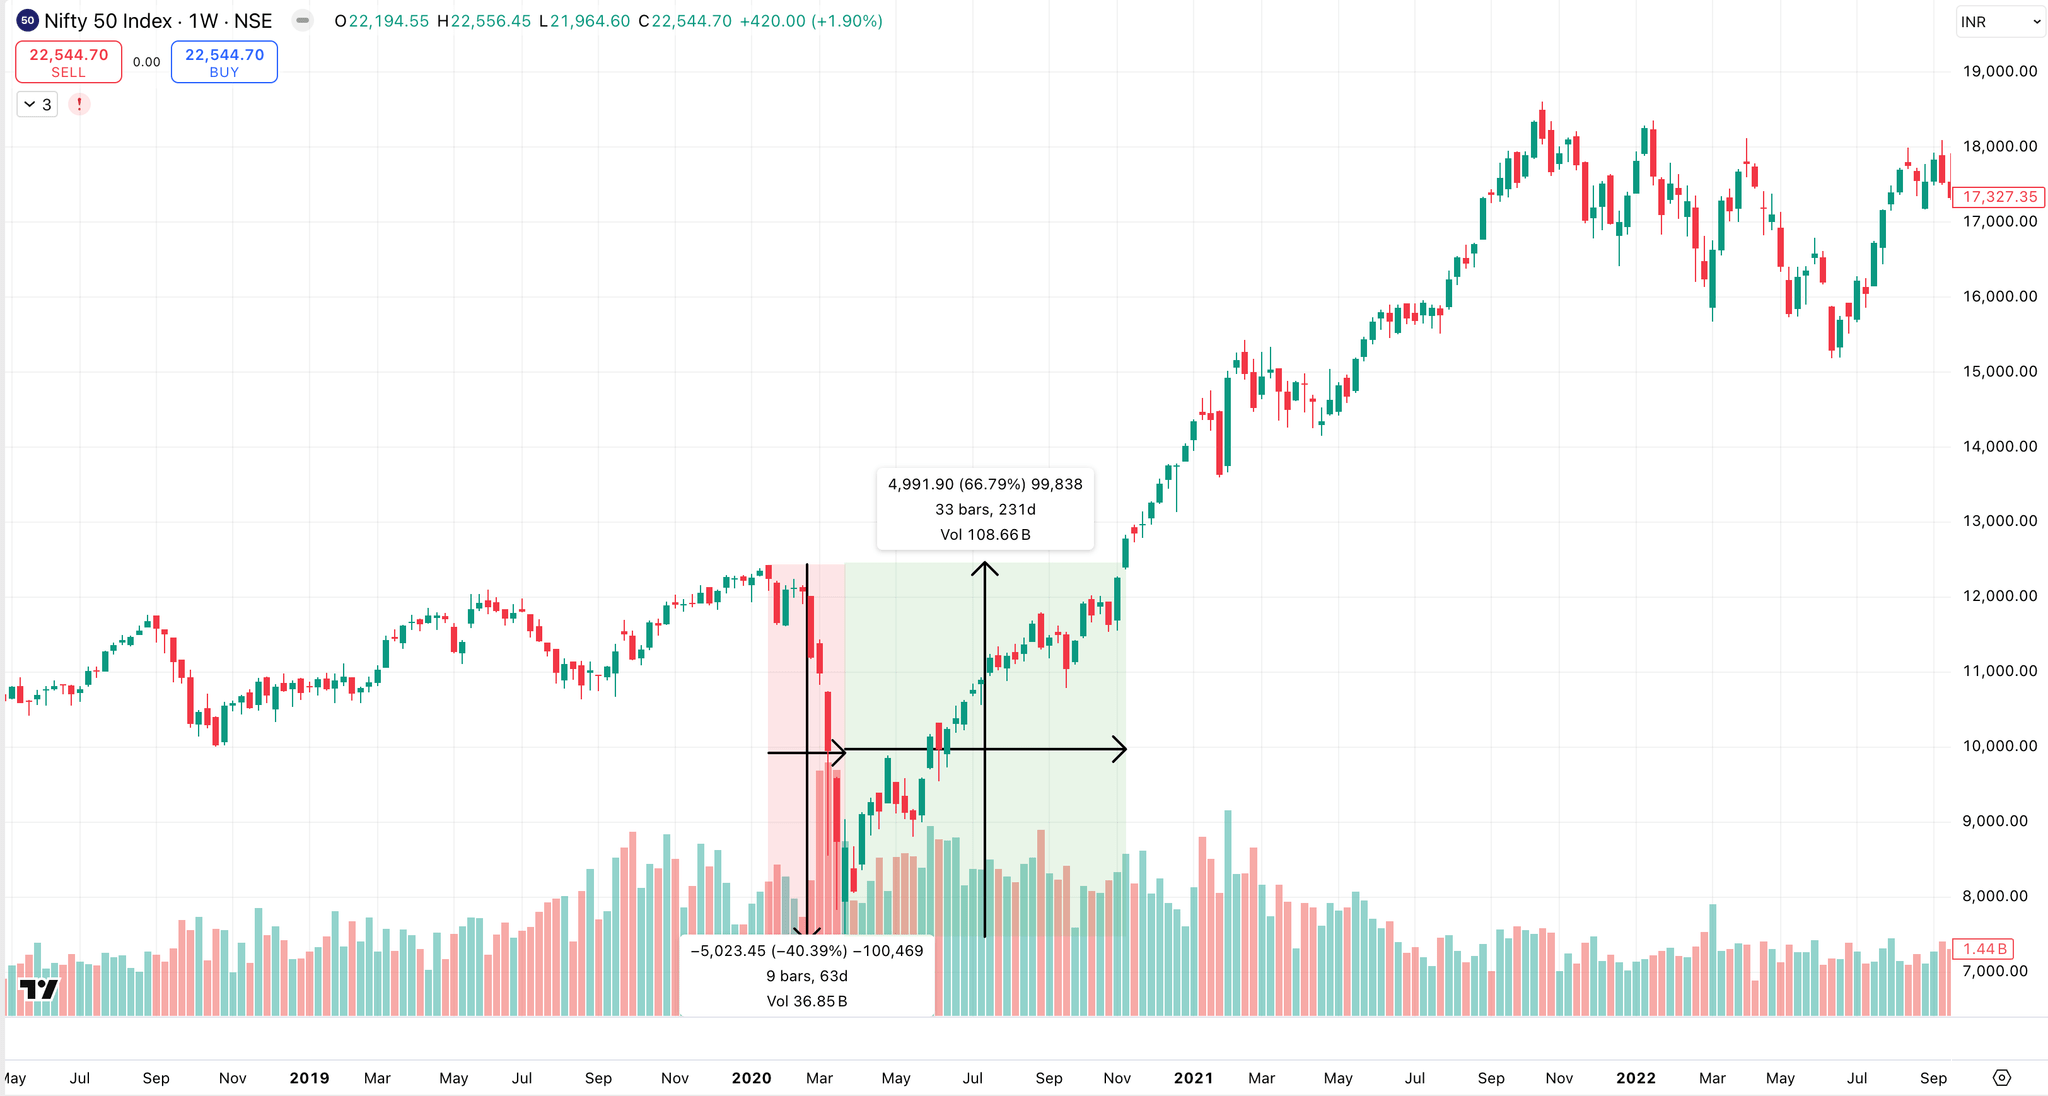
2020 COVID-19 Crash: The Fastest Market Recovery
The COVID-19 pandemic brought the global economy to a standstill – lockdowns, supply chain disruptions, and corporate shutdowns fueled panic. Investors scrambled to de-risk, sending markets into freefall.
Nifty 50 crashed 40% in March 2020 – one of its steepest falls ever.
But the recovery was swift! In just 8 months, by November 2020, Nifty had fully bounced back to pre-pandemic levels.
But if we look at the FII inflow data of both 2008 and 2020, it tells an interesting story…
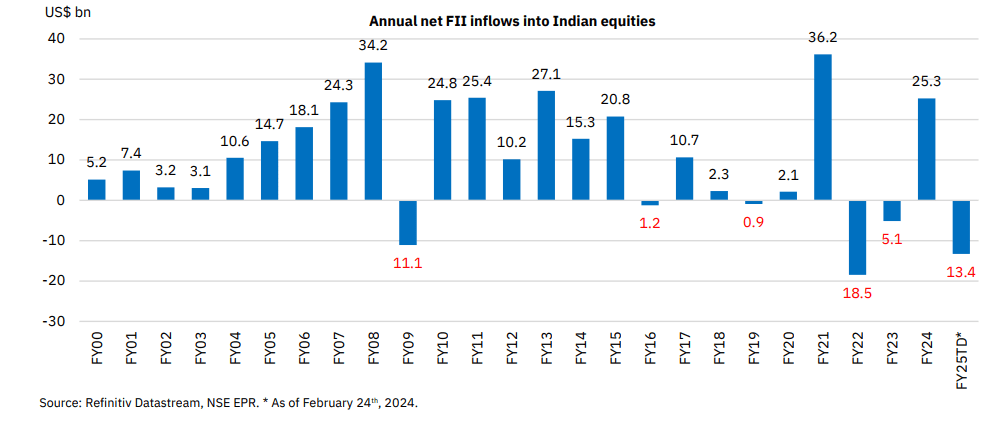
In 2009, the global financial crisis saw FIIs pull out $11.1 billion, triggering panic-driven selling as liquidity dried up.
In 2022, COVID-19 sparked another massive sell-off, with FIIs dumping $18.5 billion, the highest-ever outflow in a single fiscal year – followed by a sharp rebound.
Now, in FY25TD, FIIs have already withdrawn $13.4 billion. But unlike past crises, this isn’t about external shocks – it’s concerns over high valuations, slowing growth, and U.S. rate uncertainty. Add to that Trump’s re-election risks and global trade worries, and investors are treading cautiously.
History says markets stabilize in 6-12 months and FIIs return after peak outflows. But will this time be different? Let’s see.
We believe this pretty much answers the question: Is India’s economy really so risky that FIIs won’t return?
What Now? The One Investment Approach That Always Stands the Test of Time
Alright, let’s be real – the market’s been a roller coaster, and seeing red in your portfolio isn’t fun. Investors probably thinking, “Should I sell before it crashes more?” or “Will waiting make things worse?”
Here’s the thing – history shows markets recover, businesses innovate, economies grow, and those who stay the course often come out stronger.
Instead of stressing over what’s out of your control, what if you focused on what is? The question isn’t what the market will do next – it’s how you choose to respond.
Markets Are on Sale – Ever Thought of It That Way?
If your favorite brand had a 50% sale, would you stop buying? Nope.
That’s what’s happening now – many good stocks are cheaper. Despite the downturn, SIP inflows remain resilient with only a slight slowdown (don’t worry, we won’t throw more numbers at you – we covered that already)! The point is, that investors are still buying.
So, is this a time to pause, or a time to stay the course? That’s up to you.
If Red Numbers Stress You Out, Try This Instead
Let’s be real – checking your portfolio daily won’t turn losses into gains.
Think back to 2008 or 2020. Watching stocks fall every day felt brutal. But five years later? Those who stayed invested saw a completely different story.
Markets don’t move in straight lines – they move in cycles.
What if, instead of obsessing over daily moves, you focused on your long-term progress?
Some Businesses Struggle, Others Come Out Stronger
Ever noticed how some people thrive under pressure while others break? Companies are the same.
Strong businesses with solid earnings and low debt usually weather the storm and come back stronger. Yet, time and again, panic-driven investors sell great stocks – only to regret it when prices rebound.
So, is this a time to exit or hold onto fundamentally solid companies? Worth thinking about.
The Smartest Investors Don’t Rely on Just One Bet
What if all your money was in one stock? Too risky, right? The same applies to your portfolio.
Multi-asset portfolios soften the blow during market crashes. Take gold -it often rises when stocks fall, offering a safety net.
It’s all about balance, not extremes. So, could diversifying help manage risk better? Worth thinking about!
Everyone Has an Opinion – But Who’s Responsible for Your Money?
Listen to every headline and so-called market expert, and you’ll always be reacting, not planning.
History proves that those who stayed invested through past crises saw their wealth grow. But here’s the catch – no one else is responsible for your decisions.
The real question isn’t what the market will do next – it’s how you choose to handle it.
Final Thought
No one knows exactly when the market will recover or which stock will shine the brightest.
Every crash feels like the worst when you’re in it. But history proves that those who stay invested emerge stronger.
So, no predictions, no advice – just facts and perspectives to help investors make informed decisions.
But one thing we all share is our belief in India’s growth story. Markets may rise and fall, but their impact is real – for you, for us, for everyone.
This too shall pass. The real question is – will you be ready when it does?
You’re not alone in this journey – we’re in it together.


