

The RSI Myth: Is This Popular Indicator Worth Using? (Part 2: Research Report)
- Share.Market
- 7 min read
- 25 Sep 2025


If you’ve spent any time exploring trading strategies, you’ve likely come across RSI—the Relative Strength Index. It’s one of the most popular technical indicators, praised for spotting ‘overbought’ and ‘oversold’ levels.
But here’s the question nobody asks:
Does RSI actually help you make money?
To find out, Share.Market ran a 25-year backtest of RSI strategies across India’s top indices stocks: Nifty 50, Nifty Next 50, Midcap 150, Smallcap 250, and Nifty 500. The goal? Cut through the hype and see if RSI has real, profitable potential.
The 3 RSI Strategies We Put to the Test
The 3 RSI Strategies We Tested
- RSI 30-70 Cross
- Buy when RSI crosses above 30
- Exit when RSI crosses above 70
- RSI 50 Cross
- Buy when RSI crosses above 50
- Exit when RSI crosses back below 50
- RSI vs. RSI EMA Cross
- Buy when RSI crosses above its EMA (Exponential Moving Average)
- Sell when RSI crosses below its EMA
Each strategy was evaluated as:
- Long-only: Buy on signals, exit later
- Short-only: Short-sell on signals, cover later
- Combined: Switch between long and short
Success Metrics
Each trade’s performance was measured by:
- Expected Return per Trade % = (Avg Win% × Win Rate – Avg Loss% × Loss Rate) / Total Trades
This shows the average gain or loss from every trade over the entire test period.
- Expected Return per Trade per Day % = Expected Return per Trade ÷ Average holding period
This normalizes performance based on holding period, helping traders understand how much potential return a strategy generates daily.
- Win rate: no. of winning trades/ total number of trades
Percentage of trades that ended profitably.
Top Takeaways from the Backtest
- Short Trades Failed. Long Trades Won
- The first insight was clear:
Long-only trades worked. Short-only and combined strategies didn’t. - Short strategies consistently generated losses across indices. RSI, it turns out, is better at identifying bullish setups in Indian markets.
- The first insight was clear:
- RSI 30-70 Cross: Big Returns, But You’ll Wait Forever
Look at the two tables below carefully.
- RSI 30-70 Cross generated the highest returns per trade.
- But its drawback? Patience. This strategy produced just 1 trade per stock per year on average.
- RSI EMA Cross and RSI 50 Cross, in contrast, generated smaller returns per trade—but with thousands of trades and faster capital rotation.


What these 2 table shows: RSI 30-70 Cross generates the highest returns per trade but is slow, while RSI- RSI 100 EMA Cross provides better daily returns thanks to faster trade cycles.
The Tradeoff: High Returns or High Frequency?
So, which is better?
- RSI 30-70: Bigger returns per trade but painfully slow signals.
- RSI EMA Cross / RSI 50 Cross: Smaller gains but more trades and faster returns.
It boils down to your trading style:
Do you prefer fewer, high-conviction trades? Or fast, frequent setups to rotate your capital?


Optimizing RSI: Can Tweaking the RSI Period Improve Performance?
Next, we fine-tuned RSI’s lookback period:
- 7-period (short-term)
- 14-period (default)
- 21-period (long-term)
And the results were fascinating.
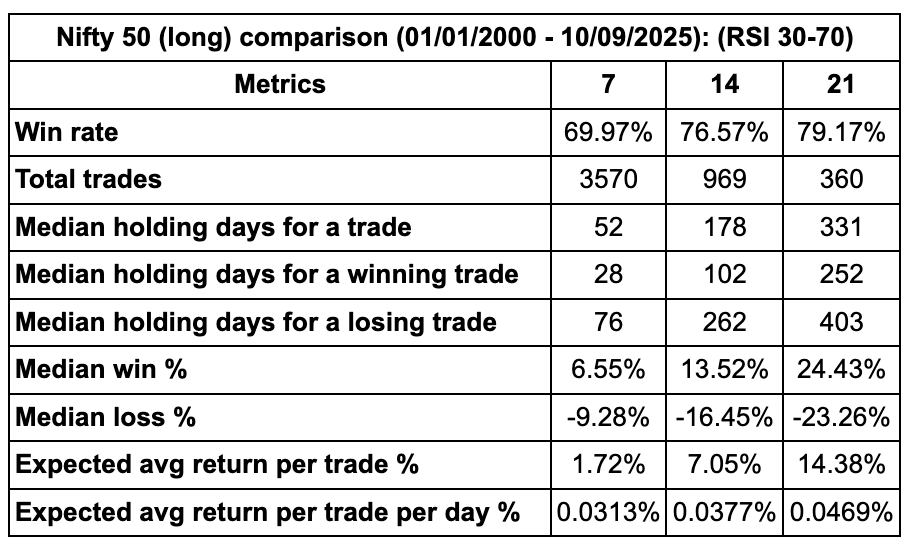
- For RSI 30-70 Cross, a 21-period RSI delivered the highest win rate (79.05%) and largest returns per trade (15.65%), but trade frequency dropped significantly, making it ideal for long-term investors.

For RSI 50 Cross, a 7-period RSI gave the best daily returns, thanks to faster signal generation and shorter holding periods. This suits traders seeking more frequent opportunities.

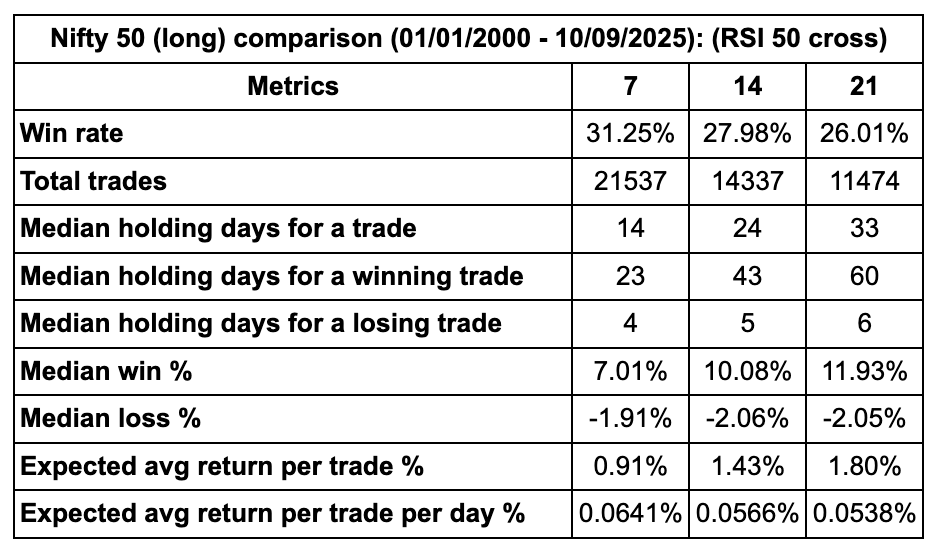
What these tables show: For long-term, high-return trades, go with RSI 30-70 and a 21-period RSI. For faster, more frequent gains, choose RSI 50 Cross with a 7-period RSI.
Digging Deeper: Can EMA Settings Enhance RSI EMA Cross?
Tweaking EMA periods (100, 200) showed that:
- Shorter EMAs = Faster signals.
- Shorter EMAs = Slightly higher win rate
So, active traders should stick to 100 EMA settings for best results.
Below, we summarize the best daily returns for each RSI period and EMA combination:

Conclusion: Which RSI Strategy Should You Use?
- Long-Term Investors: Use RSI 30-70 Cross with a 21-period RSI. The signals are rare but strong, with higher returns per trade and better win rates.
- Active Traders: RSI EMA Cross or RSI 50 Cross with a 7-period RSI offers faster entries, higher daily returns, and frequent trades to rotate capital effectively.
- Avoid Short Strategies: Across all methods and indices, short-only and combined long-short strategies consistently failed to deliver an edge. RSI works best when identifying bullish signals, not bearish ones.
- Balance Your Approach: Depending on your risk appetite and investment horizon, mix slow, high-conviction signals (RSI 30-70) with faster, frequent signals (RSI EMA Cross) to create a more versatile strategy.
Real-World Limitations
This study is directional—not a plug-and-play trading system. Key limitations include:
- End-of-Day Execution: All signals are based on daily closing prices, not real-time data. This means factors like slippage, bid-ask spreads, brokerage fees, and intraday volatility are not captured.
- Static Index Constituents: We used the current composition of indices throughout the backtest. In reality, index members change over time. This standardization ensures uniformity but is not perfectly reflective of real historical conditions.
- Missing Data or Failed Trades: The study does not account for missing data points or trades that fail to execute.
Key Takeaway:
RSI isn’t a magic indicator, but when optimized and used thoughtfully, it can consistently deliver profits in Indian markets. The real key lies in choosing the right method, tuning the parameters, and aligning the strategy to your trading style.
Disclaimer and Disclosure
Investments in the securities market are subject to market risks, read all the related documents carefully before investing. Registration granted by SEBI, enlistment as Research Analyst with Exchange and certification from NISM in no way guarantee performance of the intermediary or provide any assurance of returns to investors. Kindly refer to https://share.market/ for more details.Investments in WealthBaskets are subject to the Terms of Service. All investors are advised to conduct their own independent research into investment strategies before making an investment decision. Mutual Fund investments are subject to market risks, read all scheme related documents carefully. PPWB acts as a distributor of mutual funds and it is not an exchange traded product. PPWB acts as a distributor of mutual funds and WealthBaskets and it is not an exchange traded product. Disputes with respect to the distribution activity of Mutual Funds and WealthBaskets will not have access to Exchange investor redressal or Arbitration mechanism. The securities are quoted as an example and not as a recommendation. This is for informational purposes and should not be considered as recommendations.
PhonePe Wealth Broking Private Limited is a member of NSE & BSE with SEBI Regn. No.: INZ000302639, Depository Participant of CDSL Depository with SEBI Regn. No.: IN-DP-696-2022, Research Analyst with SEBI Regn No: INH000013387, BSE RA Enlistment Number: 5887 and Mutual Fund distributor with AMFI Registration No: ARN- 187821. Member ID: BSE- 6756, NSE- 90226. Registered office – 2, Floor 3, Wing A, Block A, Salarpuria Softzone, Service Road, Green Glen Layout, Bellandur, Bengaluru South, Bengaluru, Karnataka – 560103, INDIA. CIN: U65990KA2021PTC146954


