

GDP Chronicles: State-wise Insights into India’s Economic Growth
- Share.Market
- 6 min read
- 04 Jun 2024


India is a country known for its rich cultural heritage and abundant natural resources. Additionally, it is the fifth-largest economy globally. As of the third quarter of 2024, India’s nominal GDP has reached USD 4.112 trillion, indicating an impressive growth rate of 8.4% based on estimates from the Ministry of Statistics.
Projections from the Ministry of Finance forecast a continued growth of 7.6% in 2024, surpassing the growth rates of major economies such as the US, Russia, and France. This upward trajectory highlights India’s journey towards emerging as a leading economic force on the global stage.
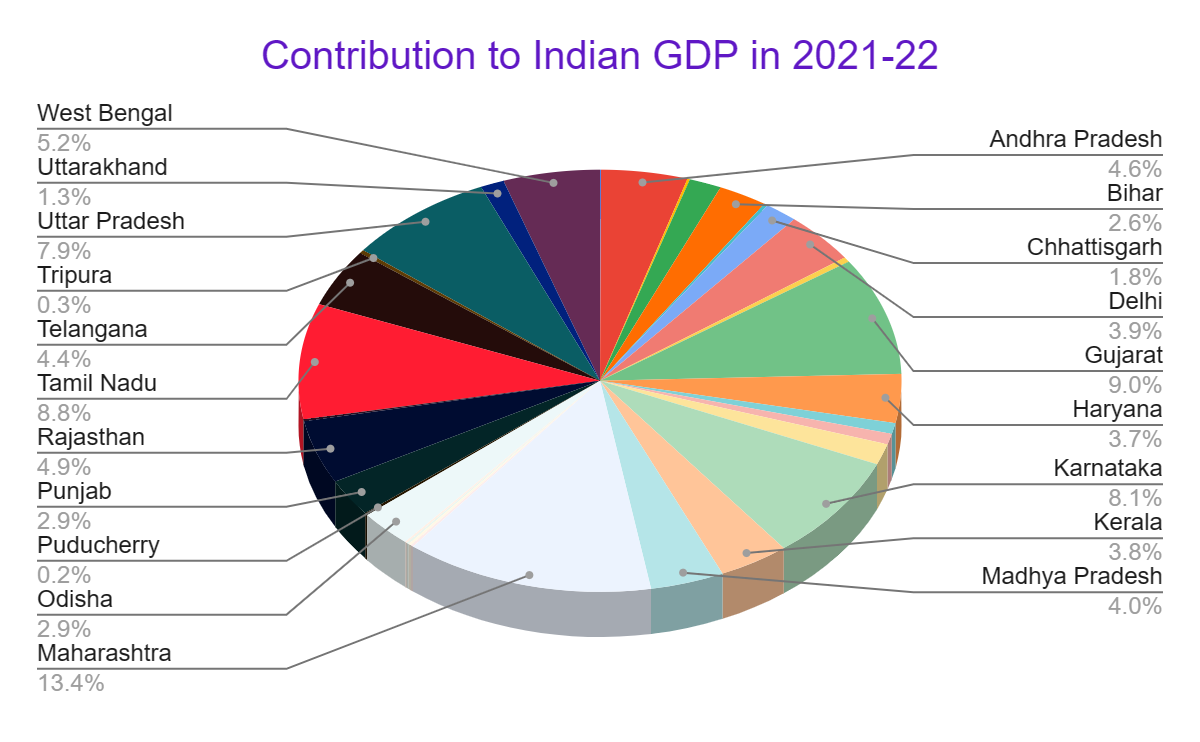
State-wise contribution of each state to India’s overall GDP
Gross State Domestic Product (GSDP) is a crucial metric that measures the total value of goods and services produced within a state’s borders over a specific period, typically a year. It serves as a key indicator to assess the economic health and growth trajectory of the state, providing insights into the magnitude and direction of its economic development over time.
The state domestic product is classified into three broad sectors such as primary sector, secondary and tertiary sector. It is compiled by economic activity as per the methodology prescribed by the National Accounts Division, National Statistical Office, Ministry of Statistics & Programme Implemented, Government of India.
Growth rate and net state domestic period
GSDP of state at Constant price (Base year 2011-12)(In Rs Lakhs)
| State/Union Territory | 2017-18 | 2018-19 | 2019-20 | 2020-21 | 2021-22 | Contribution to Indian GDP in 2022 | 2022-23 | Growth GSDP in 2023 from previous year |
| Maharashtra | 188870619 | 195738075 | 200466252 | 185836988 | 202797104 | 13.350% | N/A | N/A |
| Gujarat | 108656973 | 118301975 | 126527733 | 124111783 | 137220362 | 9.033% | N/A | N/A |
| Tamil Nadu | 112579344 | 120466736 | 124383550 | 124465002 | 134328684 | 8.843% | 145332128 | 8% |
| Karnataka | 101970817 | 108510062 | 114880569 | 110821175 | 122971294 | 8.095% | 132631929 | 8% |
| Uttar Pradesh | 105639893 | 109735324 | 114163019 | 109316845 | 120465992 | 7.930% | 130467760 | 8% |
| West Bengal | 69498050 | 73892038 | 76190077 | 71123485 | 78775806 | 5.186% | 85402292 | 8% |
| Rajasthan | 62802002 | 64327828 | 67678501 | 66351509 | 73892163 | 4.864% | 79944925 | 8% |
| Andhra Pradesh | 59473653 | 62661420 | 64981035 | 63372029 | 70488945 | 4.640% | 75433815 | 7% |
| Telangana | 55740976 | 60840139 | 64096810 | 60228375 | 67437077 | 4.439% | 72670742 | 8% |
| Madhya Pradesh | 49710165 | 54327196 | 56752504 | 54393478 | 60068910 | 3.954% | 64312424 | 7% |
| Delhi | 54201502 | 56532692 | 58616836 | 54768219 | 59776466 | 3.935% | 65264936 | 9% |
| Kerala | 51618976 | 55422831 | 55919418 | 51170291 | 57274734 | 3.770% | N/A | N/A |
| Haryana | 48203615 | 53299604 | 54427544 | 51030611 | 56808606 | 3.740% | 60842026 | 7% |
| Punjab | 37540561 | 39701889 | 41329463 | 40726410 | 43376898 | 2.856% | 46153945 | 6% |
| Odisha | 36111668 | 38673286 | 39753042 | 38912541 | 43295967 | 2.850% | 46385939 | 7% |
| Bihar | 34402783 | 38138253 | 39832923 | 36873273 | 39992978 | 2.633% | 44247256 | 11% |
| Chhattisgarh | 22013569 | 24457916 | 25132466 | 24680359 | 26768086 | 1.762% | 28908241 | 8% |
| Assam | 21991937 | 23103957 | 24070724 | 24294583 | 26252252 | 1.728% | 28919185 | 10% |
| Jharkhand | 21058730 | 22927447 | 23175539 | 21948331 | 24334844 | 1.602% | 25979986 | 7% |
| Uttarakhand | 18095612 | 18608264 | 18974025 | 17876352 | 19341230 | 1.273% | 20710398 | 7% |
| Himachal Pradesh | 10940627 | 11641398 | 12118696 | 11755479 | 12643325 | 0.832% | 13457582 | 6% |
| Jammu & Kashmir U.T. | 0 | 0 | 11391908 | 11227348 | 12472836 | 0.821% | 13471574 | 8% |
| Goa | 5265269 | 5306301 | 5481154 | 5336006 | 5554765 | 0.366% | N/A | N/A |
| Tripura | 3309278 | 3675396 | 3806335 | 3640386 | 3948668 | 0.260% | 4299733 | 9% |
| Chandigarh | 2847968 | 2986579 | 3167934 | 2861846 | 3028731 | 0.199% | N/A | N/A |
| Puducherry | 2231768 | 2620889 | 2637432 | 2402145 | 2783352 | 0.183% | N/A | N/A |
| Meghalaya | 2256433 | 2371885 | 2492339 | 2296691 | 2426676 | 0.160% | 2520850 | 4% |
| Sikkim | 1767336 | 1862497 | 1949204 | 1955700 | 2072805 | 0.136% | 2214446 | 7% |
| Manipur | 1875074 | 1826222 | 1918718 | 1807340 | 2051458 | 0.135% | N/A | N/A |
| Arunachal Pradesh | 1557222 | 1666838 | 1914031 | 1845135 | 1980053 | 0.130% | N/A | N/A |
| Mizoram | 1475778 | 1610037 | 1788426 | 1642736 | 1849372 | 0.122% | N/A | N/A |
| Nagaland | 1643983 | 1686771 | 1847679 | 1767309 | 1836336 | 0.121% | N/A | N/A |
| Andaman & Nicobar Islands | 646445 | 686699 | 726574 | 671487 | 717247 | 0.047% | N/A | N/A |
| Jammu & Kashmir* | 10662414 | 11506196 | 0 | 0 | 0 | 0.000% | N/A | N/A |
In 2021-22, Maharashtra has been the top contributor to the Indian GDP with 13.35%. States like Puducherry and Manipur had seen the highest growth rates in India at 15.9% and 13.5%, respectively. States which have seen double-digit growth rates are Andhra Pradesh, Gujarat, Haryana, Jammu and Kashmir UT, Jharkhand, Karnataka, Kerala, Madhya Pradesh, Manipur, Mizoram, Odisha, Puducherry, Rajasthan, Telangana, Uttar Pradesh and West Bengal. The state which has seen the lowest growth rate is Nagaland with 3.9%.
GSDP Growth Dynamics
GDSP (in lakhs) Base year 2011-12 (at Constant Price)(in Rs lakh)
| 2021-22 | 2020-21 | 2019-20 | 2018-19 | 2017-18 | |||||
| Maharashtra | 202797104 | Maharashtra | 185836988 | Maharashtra | 200466252 | Maharashtra | 195738075 | Maharashtra | 188870619 |
| Gujarat | 137220362 | Tamil Nadu | 124465002 | Gujarat | 126527733 | Tamil Nadu | 120466736 | Tamil Nadu | 112579344 |
| Tamil Nadu | 134328684 | Gujarat | 124111783 | Tamil Nadu | 124383550 | Gujarat | 118301975 | Gujarat | 108656973 |
| Karnataka | 122971294 | Karnataka | 110821175 | Karnataka | 114880569 | Uttar Pradesh | 109735324 | Uttar Pradesh | 105639893 |
| Uttar Pradesh | 120465992 | Uttar Pradesh | 109316845 | Uttar Pradesh | 114163019 | Karnataka | 108510062 | Karnataka | 101970817 |
For the last 5 years, Maharashtra has been the largest contributor to India’s GDP, and Gujarat and Tamil Nadu were the second and third most contributors. But their position kept changing over the years. Karnataka and Uttar Pradesh are the fourth and fifth most contributing states. Their position kept changing over the past five years.
Growth in states Year on Year (at constant price)
| States | 2021-22 | 2020-21 | 2019-20 | 2018-19 |
| Maharashtra | 9.1% | -7.3% | 2.4% | 3.6% |
| Gujarat | 10.6% | -1.9% | 7.0% | 8.9% |
| Tamil Nadu | 7.9% | 0.1% | 3.3% | 7.0% |
| Karnataka | 11.0% | -3.5% | 5.9% | 6.4% |
| Uttar Pradesh | 10.2% | -4.2% | 4.0% | 3.9% |
Over the past five years, the top 5 states have been growing significantly in their GDSP output but in 2020-21 all four states had a negative growth. Except for Tamil Nadu which had kept its number positive. The states have underperformed due to COVID–19.
India’s GDP Growth:
The Real GDP, or GDP at constant prices, for the fiscal year 2021-22 is estimated at Rs 146.36 lakh crore, compared to Rs 135.58 lakh crore for the previous fiscal year 2020-21. This indicates a growth rate of 8.7% for 2021-22, a significant recovery from the 6.6% contraction observed in 2020-21 due to the impact of COVID-19.
In 2018-19, the GSDP of Maharashtra at current price terms was USD 344,111 million. This is more than countries like Qatar, Israel, Portugal, Norway, Denmark, Kuwait and many more.
List of Cities in India with the highest GDP:
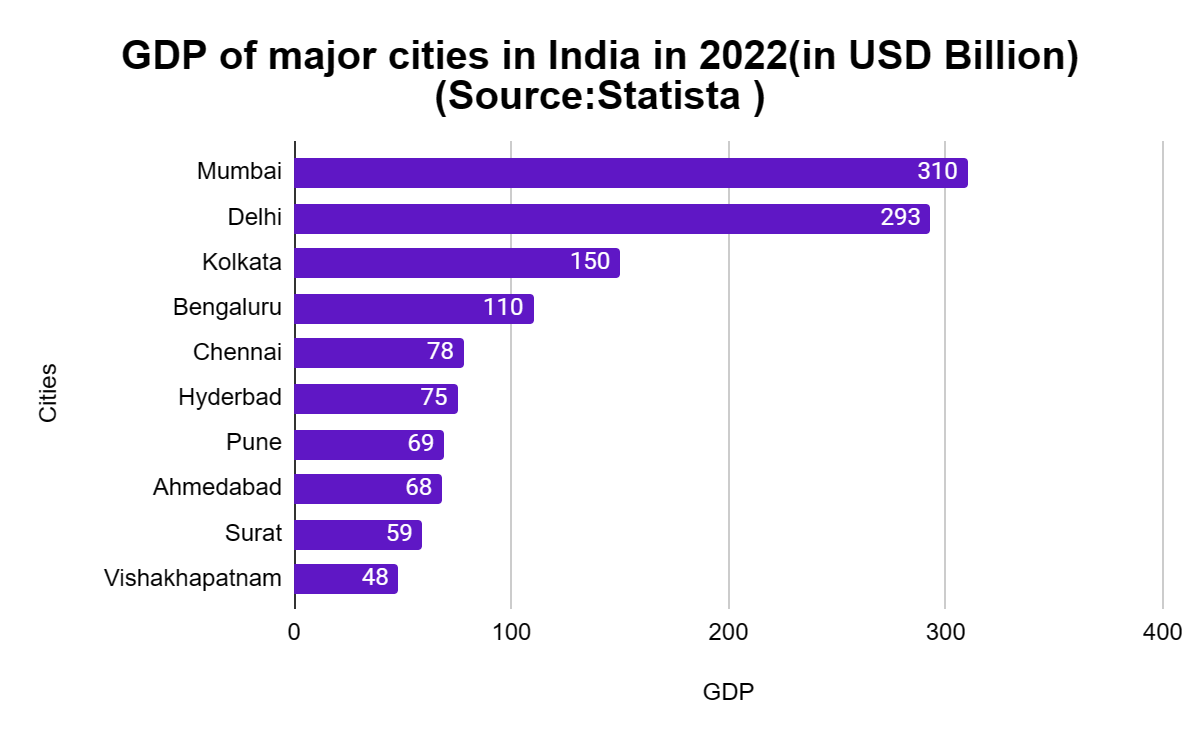
Mumbai stands as India’s financial powerhouse, fueled by its robust financial sector, thriving ports, and the influential Bollywood industry. Delhi serves as the political nerve center, while satellite cities like Noida and Gurugram bolster its economic stature. In the south, Bengaluru and Chennai have risen as prominent IT and manufacturing hubs, respectively. Hyderabad commands a significant presence in pharmaceuticals, vaccines, and IT, attracting substantial investments exceeding $3 billion from major companies such as Novartis, BMS, Sanofi, and Roche. These investments have also translated into job creation, with Hyderabad alone generating over 450,000 jobs in the last seven years.
Surat and Ahmedabad drive their economies through textile, chemicals, and machinery sectors, with Gujarat witnessing substantial foreign direct investment (FDI) amounting to Rs 2.39 lakh crore from December 2019 to December 2023.
Conclusion
The state’s Gross State Domestic Product (GSDP) measures the monetary value of goods and services produced within the state’s borders over the year. Maharashtra has consistently held a leading position in contributing to India’s GDP, with Mumbai standing out as the top city in terms of its contribution to the country’s GDP. Let’s wait and watch for the upcoming.


