
Share.Market Chronicle: 2023 Stock Market Recap
India is the focus of attention! The consensus is strong that India is going to be a strong economic power. This resilience was reflected in the Indian equity segment. The big question: What fueled the bullish surge in 2023?
The investor confidence drove the market upwards. The confidence was seen in retail participants and foreign portfolio investors. The year marked a 22% increase in the base of retail investors from 7 crores to 8.54 crores during the CY 2023.
Foreign portfolio investors (FPIs) made a comeback and injected ₹1.7 lakh crore into the Indian equity markets in 2023.
So what is the reason that investors are optimistic about the Indian stock market? The Indian economy is stabilizing due to strong macroeconomic policies, and healthy corporate earnings. The general election of 2024 is also a factor to consider as political stability has a huge impact on the stock market.
Finally, the US Federal Reserve’s decision to halt rate hikes and hint at possible cuts in 2024 prompted a shift in preference from bonds to equities.
In this blog, we’ll take a look at overall market performance in 2023. But, before we get started let’s take a detour and look at the story of NIFTY 50.
Ever Wondered About the Incredible Journey of NIFTY 50?
It all began in 1995 with a base value of 1000. As the years unfolded, so did its growth story. By 2007, the index had leapt to 5000, an astounding milestone. Then, a decade later in 2017, it breached the monumental 10K mark.
The pace picked up, and within just four more years, in 2021, it surged to 15K.
However, the real showstopper was 2023, as the index surged to a staggering 20K, closing at a remarkable 21,737 level by December 29. Quite the exhilarating journey, isn’t it?
Okay! Let’s look at the market performance now!
NIFTY Market Cap Performance
The NIFTY 50 surged, delivering a solid 19.4% return this year. Tata Motors secured the top spot, boasting an impressive 97% return. In contrast, Adani Enterprises faced a setback with a negative return of -26%.
Both the NIFTY MIDCAP 100 and NIFTY SMALLCAP 100 outperformed the NIFTY 50, yielding returns of 45.3% and 54.5%, respectively.
REC Ltd, part of the NIFTY MIDCAP 100, soared, achieving a remarkable triple-digit return of 262%. However, Aditya Birla Fashion and Retail Ltd suffered negative returns of -15%.
BSE Ltd emerged as the top performer within the NIFTY SMALLCAP 100, delivering an impressive 321% positive return. Conversely, Easy Trip Planners Ltd faced a setback, witnessing a negative return of -24%.
The NIFTY MICROCAP 250 index showcased a solid 64.3% return in 2023, emerging as the standout performer among indices. Within this index, 30 out of the 250 stocks experienced negative returns for the year.
The chart below shows the market cap performance of NIFTY indices in 2023.


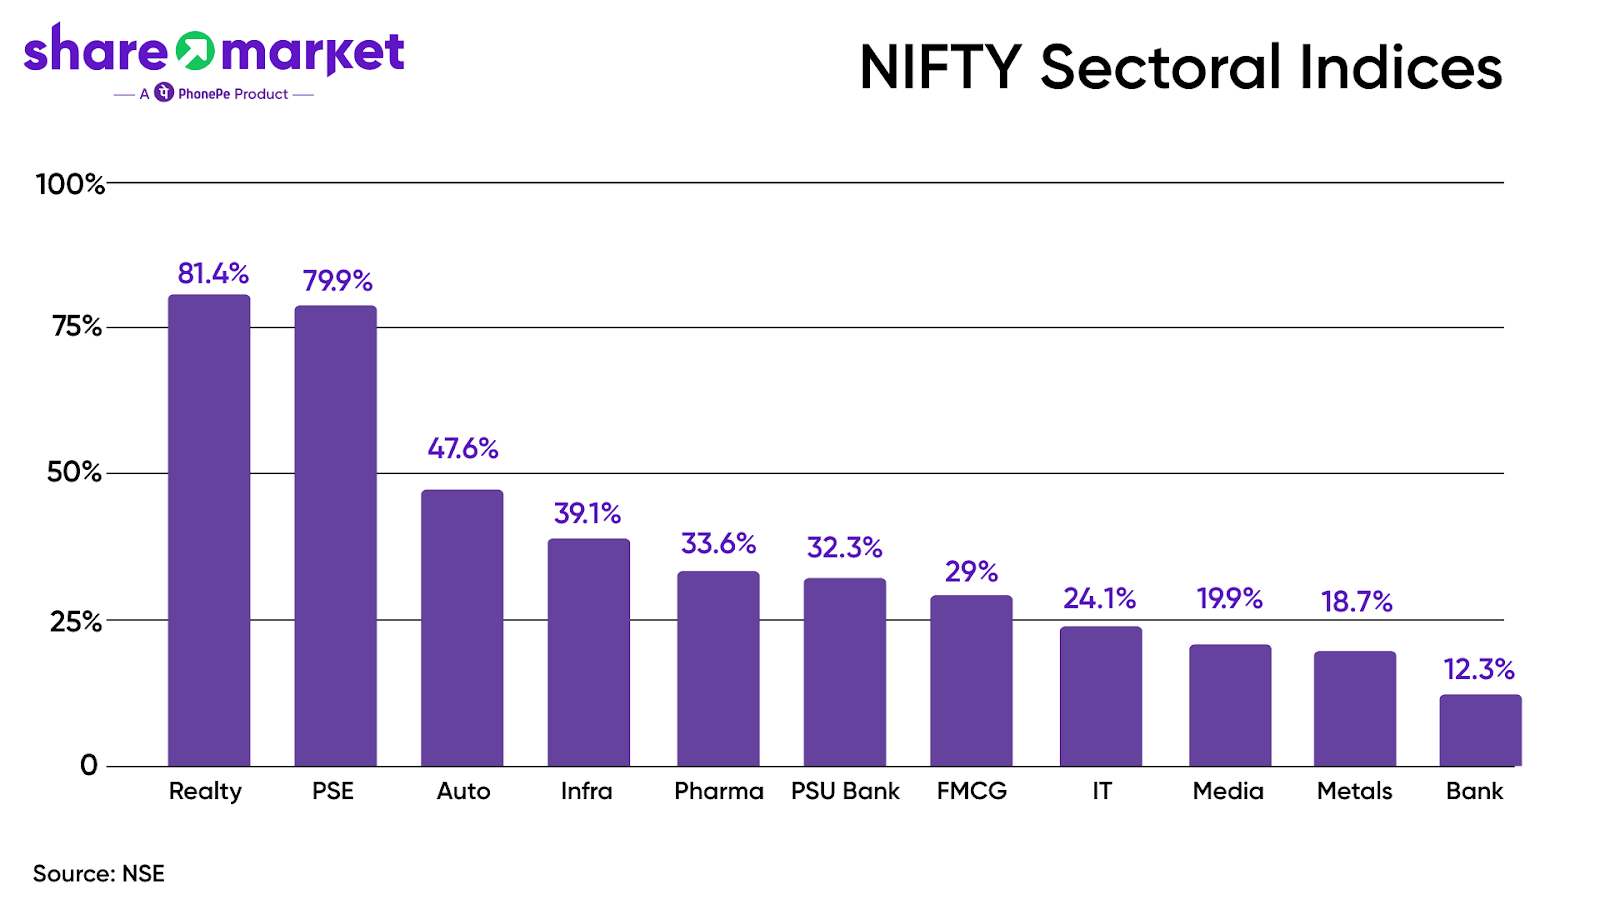
NIFTY Sectoral Return
All key indices showed positive results. Particularly, realty stood first due to strong demand primarily in the luxury segment, showing growth in housing sales in top cities.
The Public Sector Enterprises sector, specially companies in Defense and Railways, has seen strong gains driven by robust order inflows, and government initiatives like Atmanirbhar Bharat.
Following this is the Auto sector, experiencing increased demand for Medium and Heavy Commercial Vehicles. Infrastructure stands next, benefiting from favorable policies towards the sector.
PSU Banks have rallied and shown positive performance due to healthy growth in advances, net interest income (NII), reduced gross NPAs, and robust profitability.
The Pharma sector is signaling strength due to its continuous launch of new products throughout the year, with new product categories lined up for the coming financial years.
The FMCG sector has seen a significant recovery, attributed to sustained signs of rural recovery, easing inflation, and improved gross margins.
The chart below shows the sectoral performance in 2023.
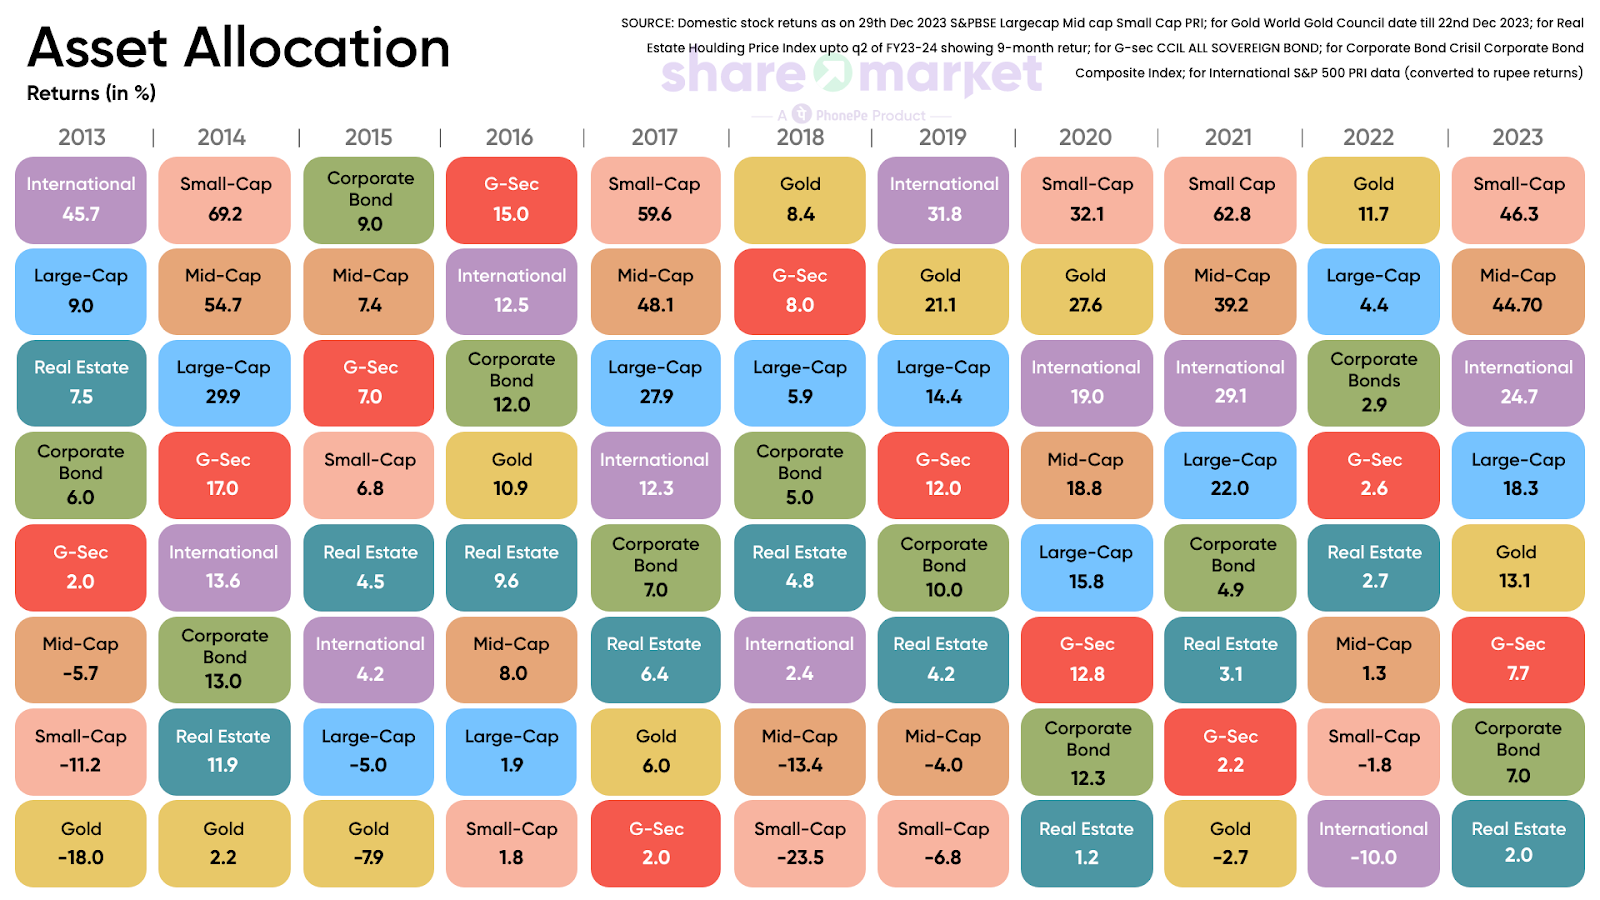
Asset Class Performance
The table shown below highlights the performance of 8 asset classes over a period of 2013 to 2023 from highest to lowest.
Here are a few key observations:
- Small Cap although a risky investment has outperformed 5 times and given negative returns thrice
- Mid Cap asset performance ranged between -13.4% to 54.7%
- Large Cap asset performance ranged between -5% to 29.9%
- G-sec and corporate bonds are considered safer assets to balance the riskier exposure from equities
- Real estate return ranged between 1.2% to 11.9%
- Gold asset performance ranged between -18% to 27.6%
- Having exposure in international markets is for those with a higher risk appetite but the decadal returns of the asset ranged between -10% to 31.8%
This decade-long overview emphasizes the strong returns from equity exposure. Long-term investments in equities tend to appreciate in value. To manage risk, diversification into secure assets like gold, G-sec, corporate bonds, and real estate is recommended.
Key Trends in the Indian Mutual Fund Industry in 2023
The mutual fund industry in India recorded significant growth in 2023. The net assets under management grew from over ₹40 lakh crore in November 2022 to ₹50 lakh crore in December 2023.
154 new schemes were launched up until November 2023. Funds mobilized till November in 2023 in equity-oriented funds stood at just over ₹30,000 crore, a 9.95% increase from the same period last year.
SIP accounts grew to 7.44 crore while the monthly investments through SIP touched an all-time high of ₹17,073 crore.
Market Movement & Net Flows
Here’s how net flow in equity-oriented funds* were in relation to the market movement in the year.
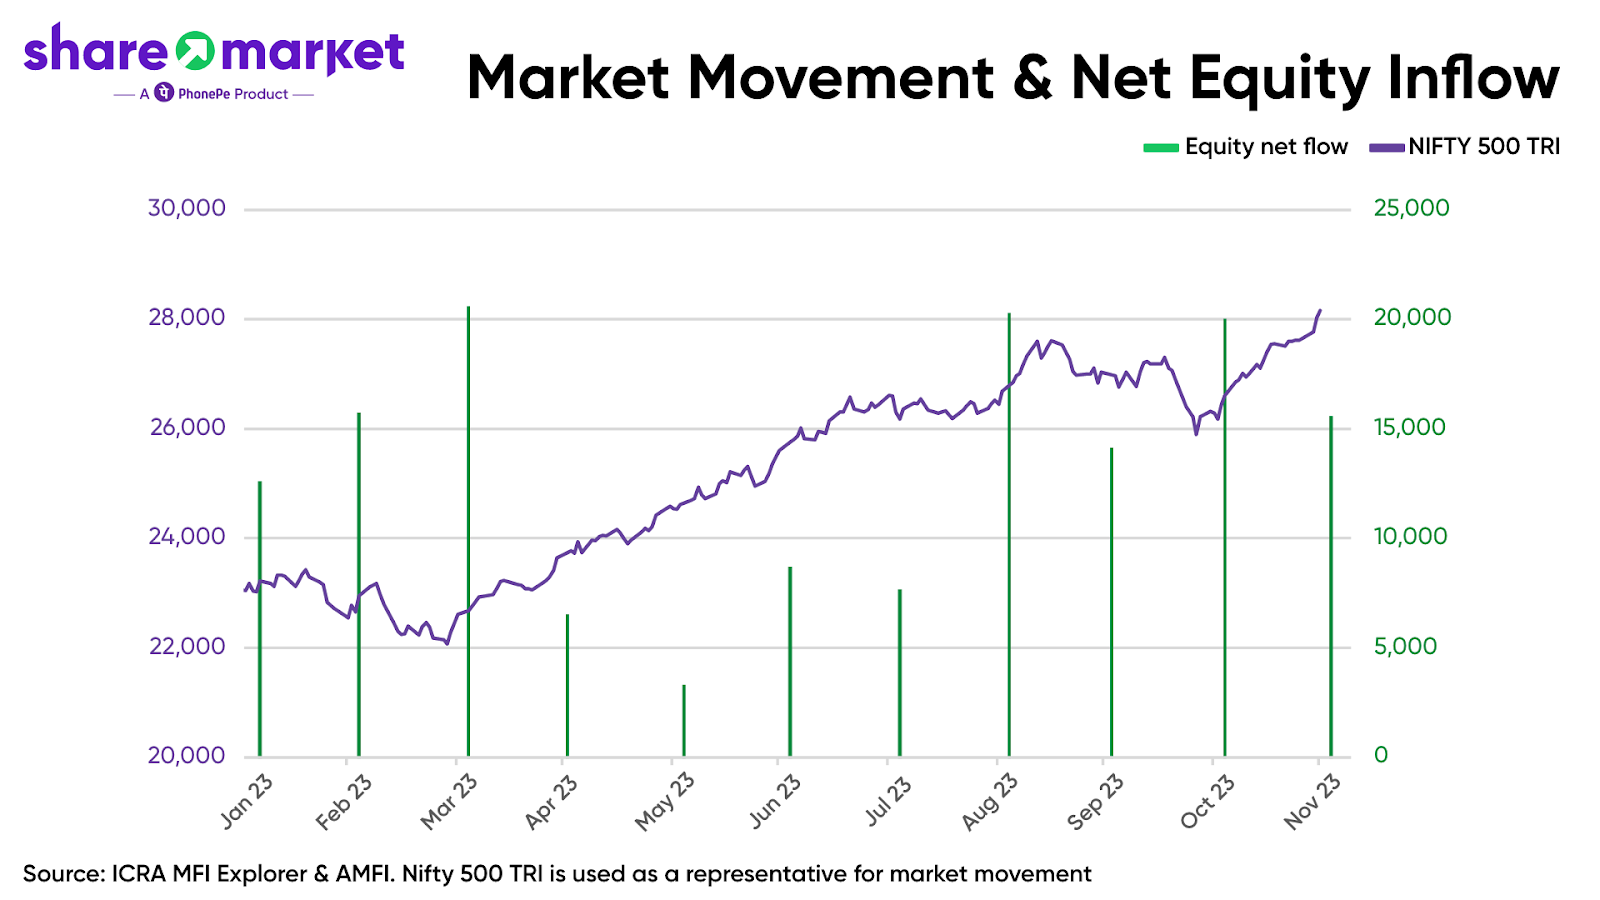
Equity funds recorded net inflow every month up until November with the highest inflow recorded in the month of March 2023. In the period from January 2023 to November 2023, the market had seen a 16.9% uptick.
While, debt-oriented schemes recorded a ₹81,015 crore net outflow in the three months ended in March 2023, which was lower than the ₹1.18 lakh crore net outflow it recorded in the same period last year.
A surprising statistic was that the quarter after the indexation benefit was removed for debt-oriented funds, the category saw a net inflow of ₹1.38 lakh crore in the quarter that ended on June 30, 2023, compared to a net outflow of ₹70,213 crore on same quarter year ago.
Rise of Mid-cap & Small-cap
Another key trend that emerged in 2023 was the rise of midcap and smallcap equity funds.
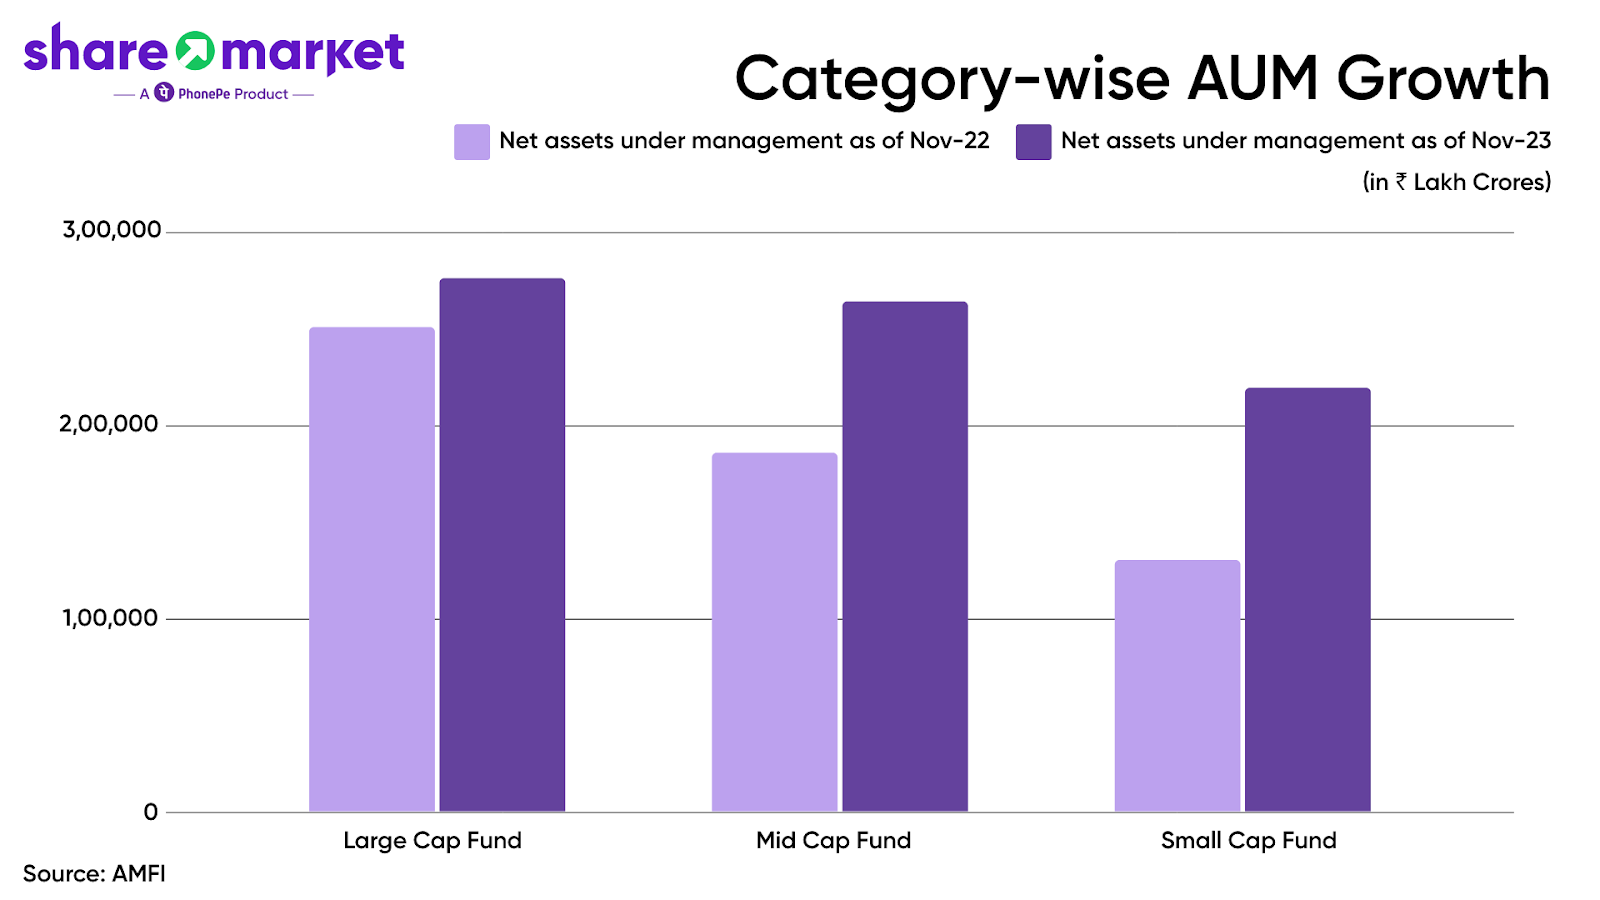
The growth in net assets under management for large-cap funds stood at over 10%, while the same number for midcap and small-cap funds stood at 41% and 69% respectively. The smallcap growth came against a 38% growth in the smallcap index in the same period.
Overall net assets under management were highest under large-cap funds at ₹2.76 lakh crore while it was at ₹2.64 lakh crore for midcap funds and ₹2.20 lakh crore for small-cap funds.
Mutual Fund Equity Holding Period
A promising statistic that emerged in 2023 was the improvement in the long-term holding of equity mutual funds.

Investors holding equity assets for more than 24 months improved by nearly 18% to 51% at the end of June 2023 as compared to June 2022.
*Equity-oriented funds exclude index funds and ETFs, in line with the AMFI classification
India’s Economic Growth
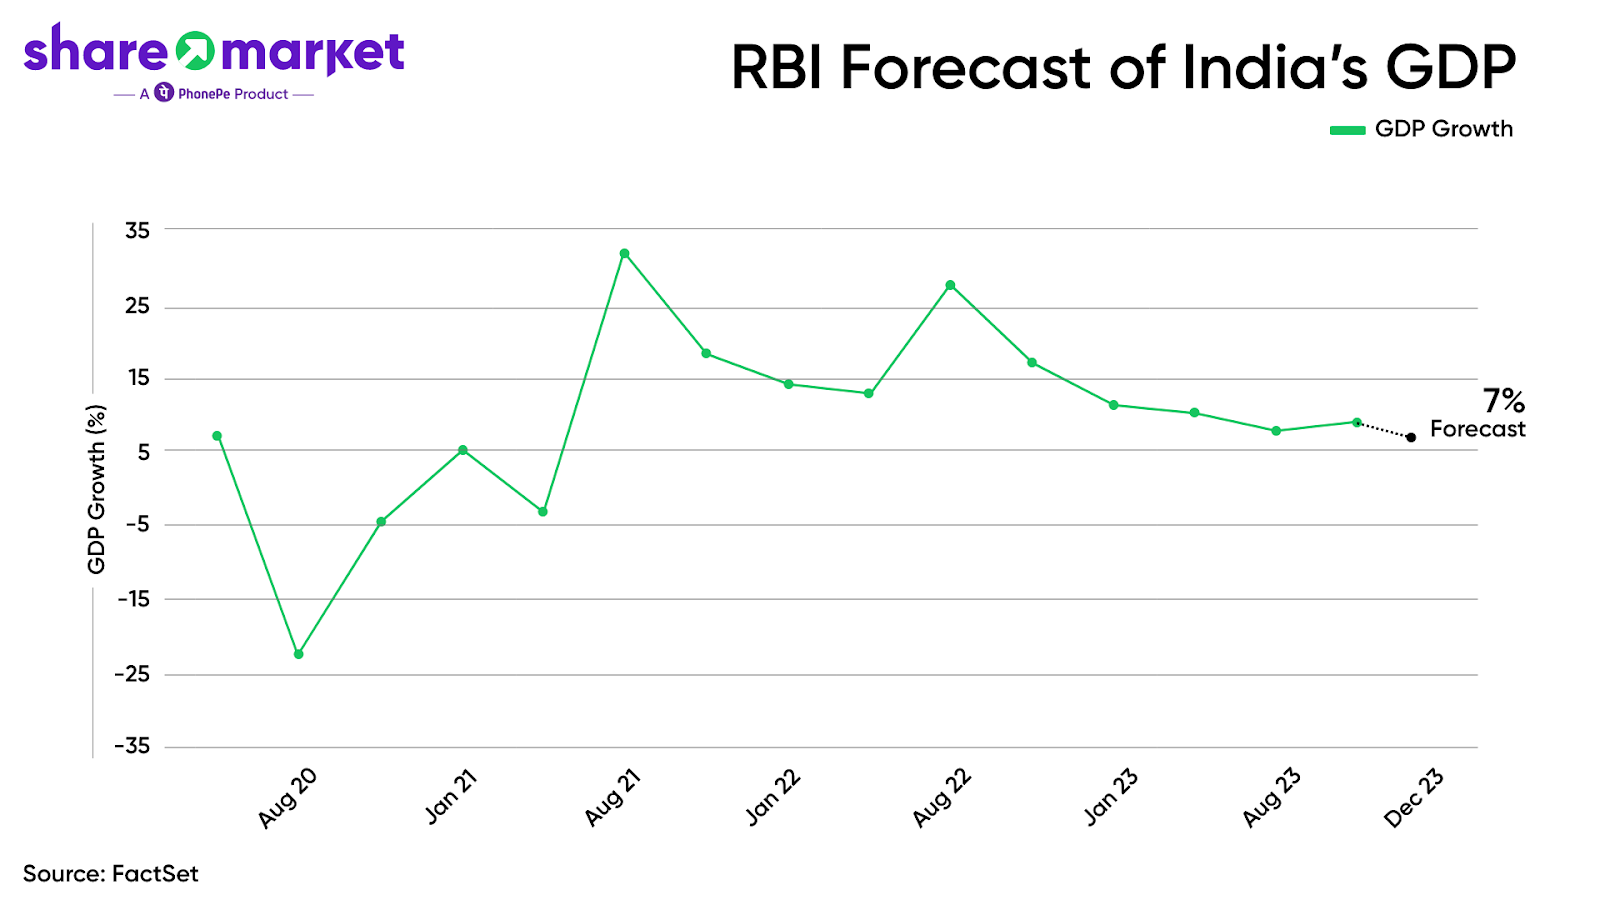
The chart below shows the GDP Growth rate from 2020 to 2023. COVID-19 disruption caused the Indian economy to drop and inflation rose in FY 2020-21.
India now shows a recovery pattern driven by strong domestic demand and government initiatives.
This year, the central bank increased its forecast for GDP growth by 50 basis points to 7%.
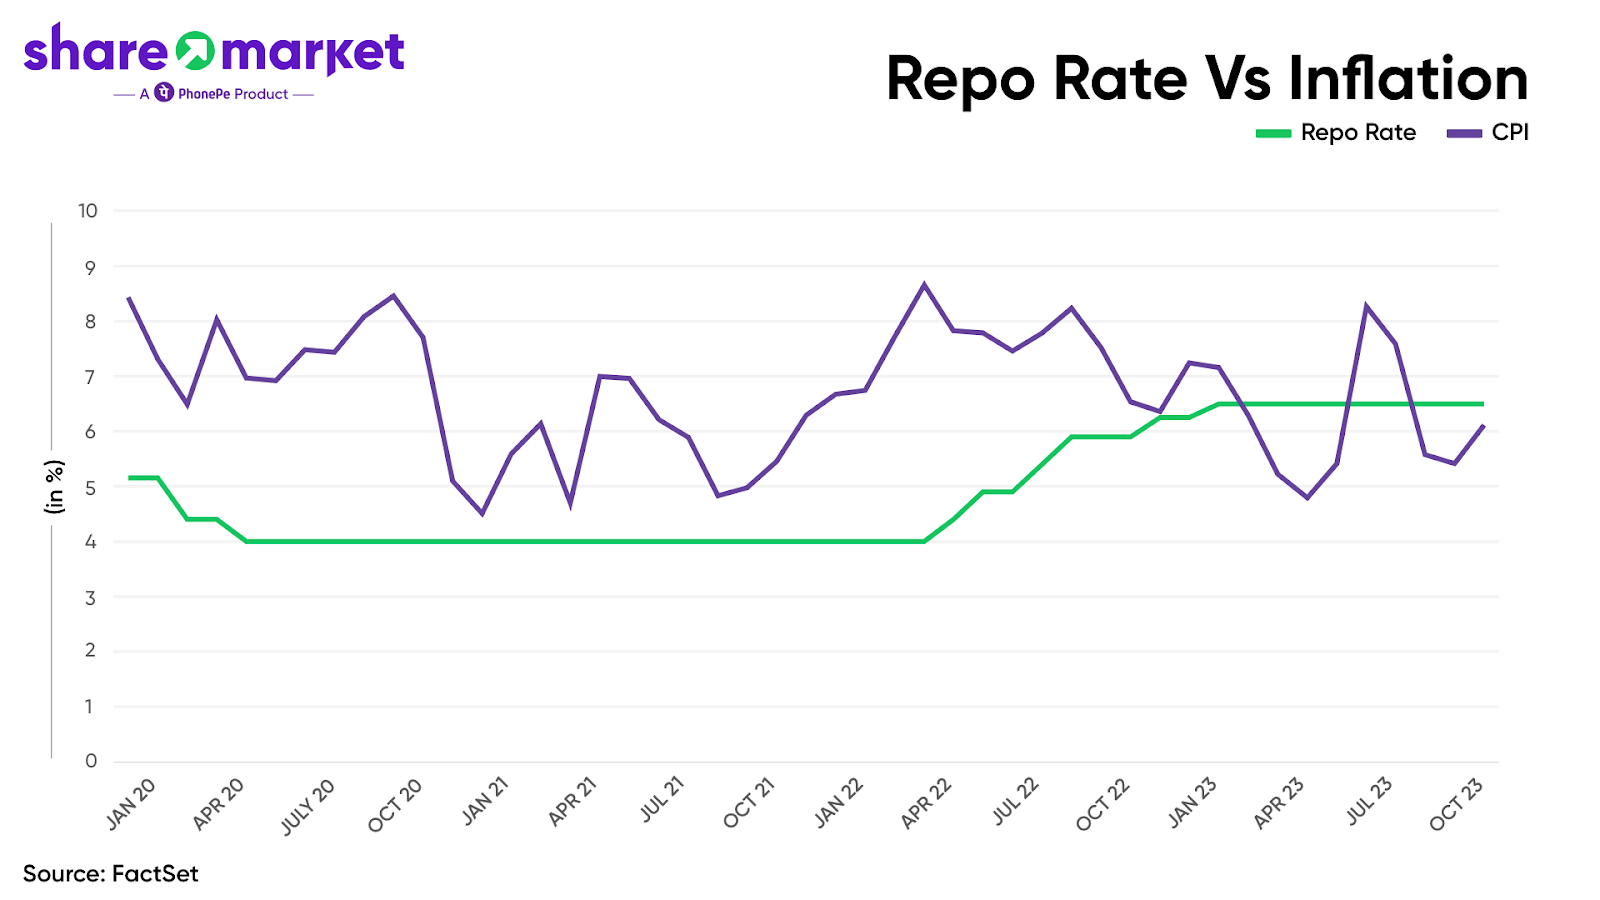
In response to the COVID-19 outbreak’s impact on business activity, the RBI initially reduced the repo rate from 4% in May 2020 to boost credit flow in the economy.
Moving ahead to 2023, the interest rate remained mostly stable. However, there was a notable exception in the February policy when the RBI raised the repo rate by 25 basis points (bps) to 6.50%. This rate has been upheld since then, marking a consistent stance.
Subsequently, in the following five policy reviews of 2023, the central bank maintained this steady rate, emphasizing a consistent approach to policy decisions. The central bank skillfully balanced curbing inflationary pressures and maintaining economic growth all year long.
The chart below represents CPI and repo rate movement from 2020 to 2023.
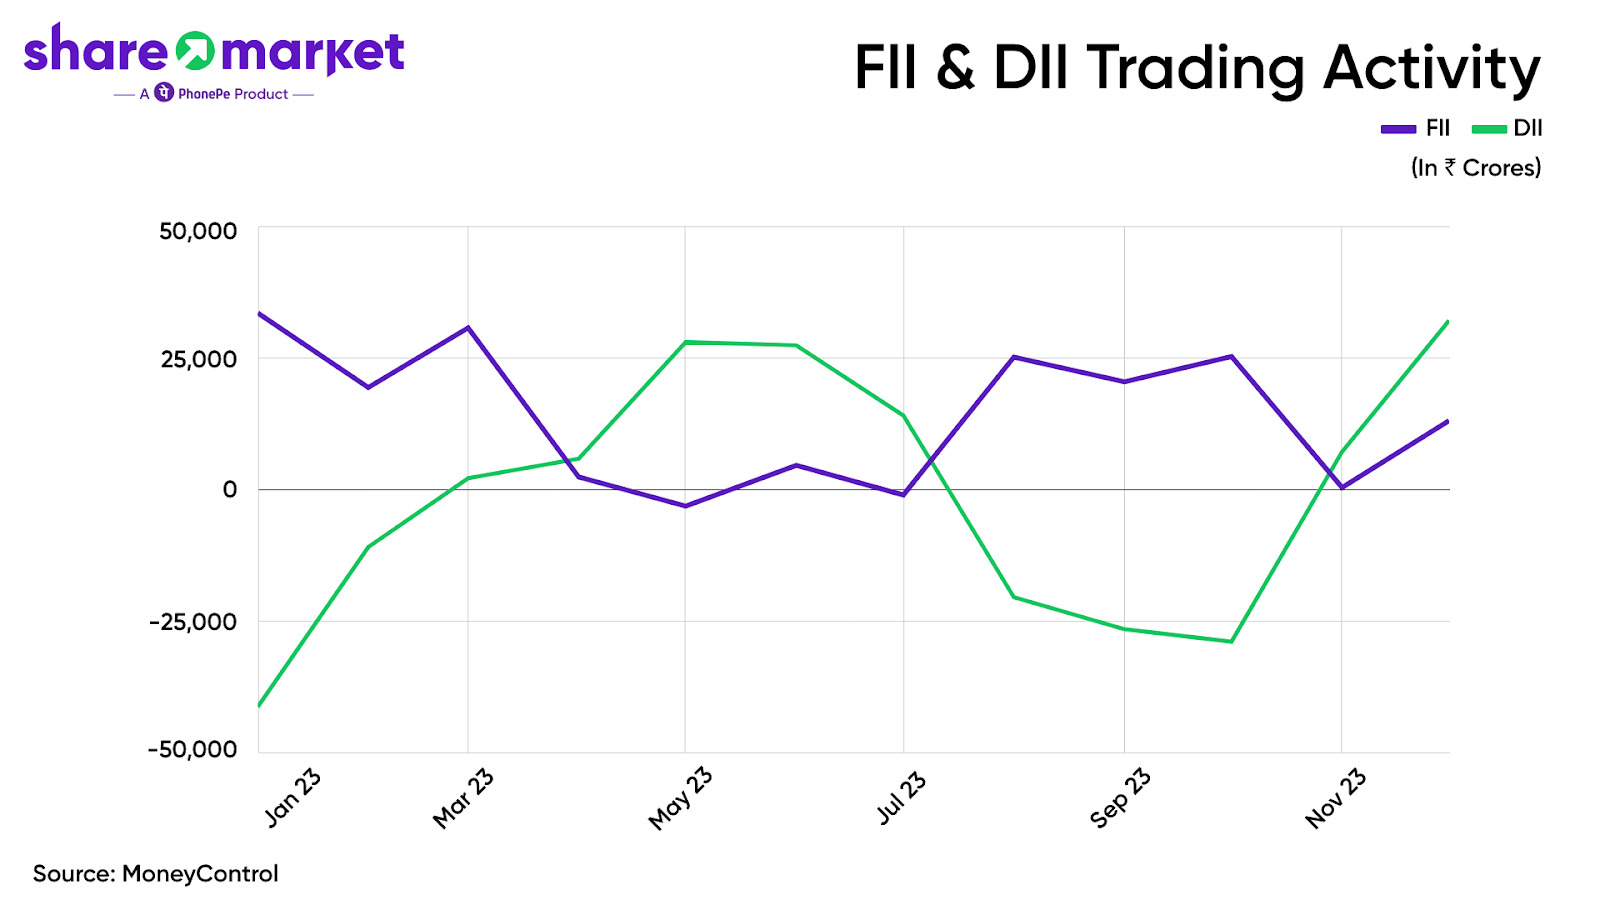
FII and DII Trading Activity in 2023
The below chart reflects the net FII and DII cash flows into the markets in 2023. FII inflow was strong as they were the net buyers while DII were net sellers.
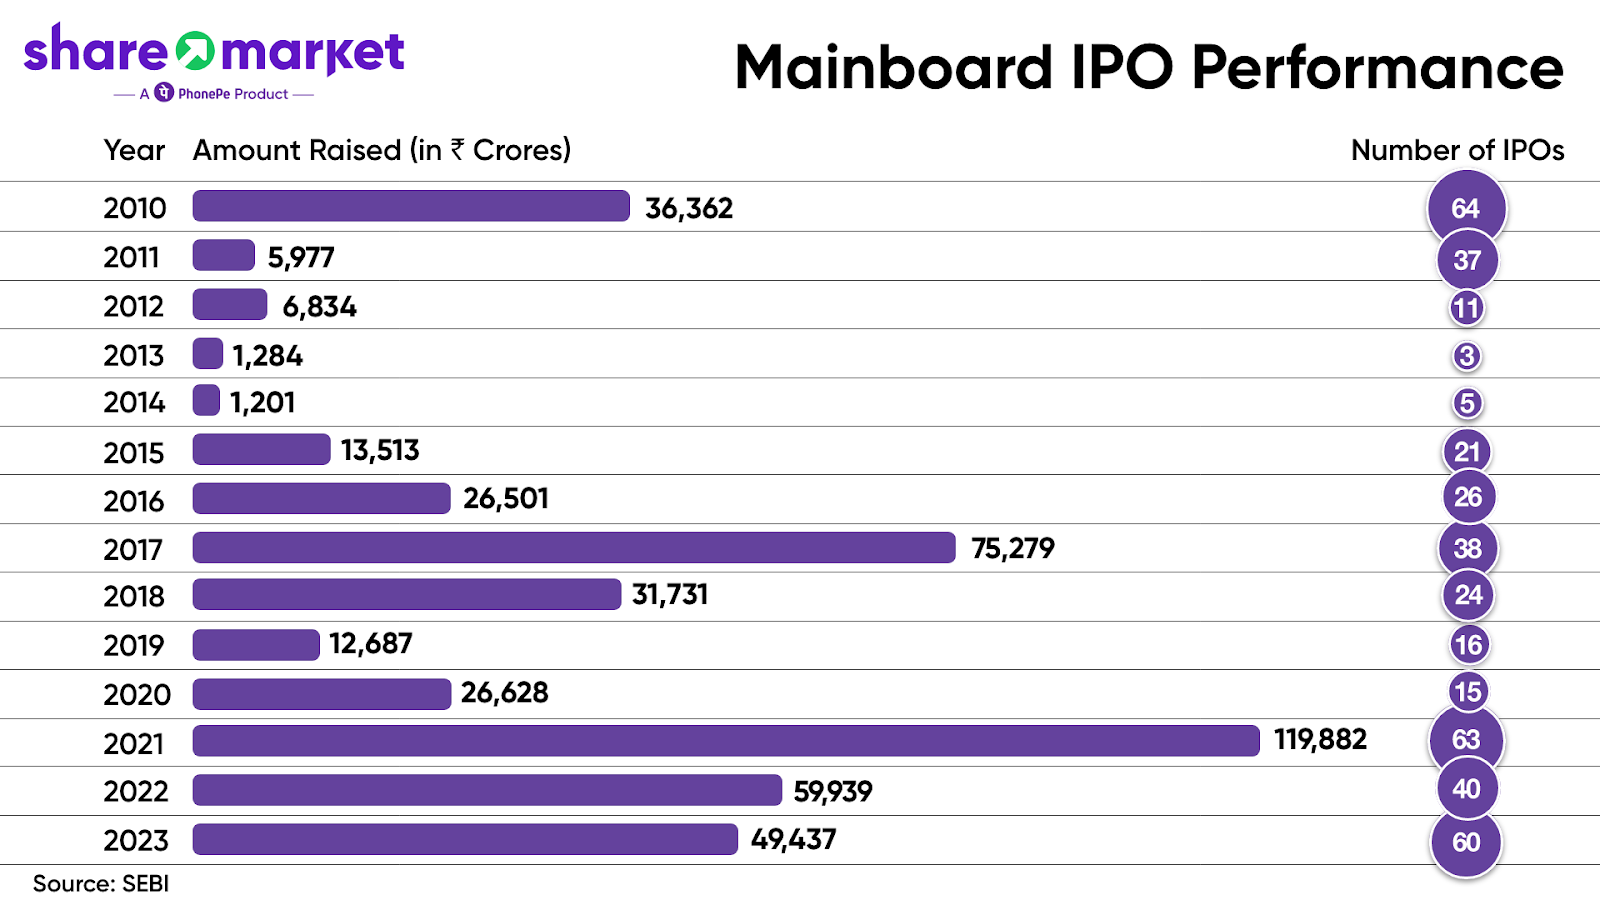
A Booming IPO Season
In 2023, India experienced a booming year for initial public offerings (IPOs), as many companies stepped onto the stock exchange for the first time.
Throughout the year, a wide variety of businesses, from traditional sectors to tech-driven firms, joined the capital markets.
Among the 60 mainboard IPOs raised a whopping ₹49,437 crore in funds in 2023
The chart below represents the number of IPOs that were listed between 2010 – 2023, along with the amount raised.
In Other News
Nifty Index Gains Traction Overseas: 7 New Passive Funds Debut in Japan and Korea
NSE launched seven new Passive funds in Japan and Korea. The funds track Nifty Indices. Among these, six products are dedicated to tracking Nifty 50, while one product is specifically designed to follow the Nifty 50 2x leverage index.
The collective Assets under Management (AUM) for these newly introduced products have surged, amassing a substantial sum of approximately US$ 550 million.
Making history in India, NSE Indices introduces the country’s inaugural REITs & InvITs Index
Marking a milestone, the Nifty REITs & InvITs index is launched to monitor the performance of publicly listed and traded REITs and InvITs at the National Stock Exchange.
The index calculates security weights based on their free-float market capitalization, ensuring a maximum cap of 33% per security and a combined cap of 72% for the top 3 securities. With a base date set at July 01, 2019, and an initial value of 1000, the index will undergo quarterly reviews and rebalancing.
Conclusion
The events of 2023 on Dalal Street showcased India’s rising prominence in the global economy. Overall, 2023 reflected India’s resilience and potential for sustained economic growth amidst challenges, setting the stage for continued market optimism and expansion.
The general outlook suggests that India may be entering a prolonged upward market trend. While short-term corrections might occur in the coming years, the overall sentiment remains positive.
Disclaimer: https://share.market/terms-conditions